De Intel Core i9 11900K is het topmodel van de Rocket Lake-generatie. Doordat de 11900K niet langer tien, maar acht cores telt, raakt hij zijn ipc-winst in multithreaded tests gelijk weer kwijt. Gemiddeld is de 11900K maar 10 procent sneller dan zijn voorloper. De gameprestaties zijn hooguit een kleine stap vooruit, niet groot genoeg om de AMD Ryzen 5000-processors bij te benen. In de tussentijd loopt het energiegebruik uit de klauwen; onder volle belasting verbruikt deze processor bijna 300W.
De Intel Core i7 11700K heeft net zoveel cores als topmodel 11900K, maar door de lagere klokfrequenties is het stroomverbruik minder extreem. In vergelijking met de AMD Ryzen 7 5800X blijft het verbruik wel erg hoog, zeker als je bedenkt dat die processor ook nog eens sneller is. Wel is de Core i7 11700K wat goedkoper dan de concurrent.
De Intel Core i5 11600K is wat goedkoper dan de AMD Ryzen 5 5600X, maar ook een stukje langzamer. Ook in games is de concurrent van AMD sneller. Ten opzichte van de i5 10600K is het stroomverbruik fors toegenomen, waardoor de processor weinig efficiënt is en goede koeling nodig heeft.
Vandaag introduceert Intel zijn elfde generatie Core-processors voor desktops, tot nu toe beter bekend onder de codenaam Rocket Lake. Na jarenlang gedwongen doormodderen met de Skylake-architectuur zet Intel met deze serie een grote stap, want voor het eerst in zes jaar wordt er weer een nieuwe microarchitectuur in gebruik genomen. Tweakers heeft de Core i5 11600K, Core i7 11700K en Core i9 11900K uitgebreid getest, om erachter te komen of Intel het AMD moeilijk kan maken met deze chips.
AMD heerst over de desktop
Het laatste grote wapenfeit in de wereld van desktop-cpu's was AMD's introductie van de Ryzen 5000-processors. In november concludeerden we dat AMD met die serie ook in games de leiding pakte. Deze typisch latencygevoelige workload was tot dan toe het laatste bastion waarin Intel nog aan kop ging. Hoewel ze hogere prijzen hadden dan hun voorgangers, bleken de Ryzen 5000-processors erg populair. Nog altijd weet AMD niet aan de vraag naar de snelste modellen in de Ryzen 9-serie te voldoen.
Intels tiende generatie Core-processors was toen al een half jaar op de markt en kende eigenlijk maar één noemenswaardige verbetering: een verdere verhoging van het maximale aantal cores, van acht naar tien. Zoals we dit weekend in een Plus-achtergrondartikel uitgebreid beschreven, zat Intel zes jaar lang vast aan de Skylake-architectuur en het 14nm-procedé, waardoor het toevoegen van steeds meer cores praktisch de enige mogelijkheid voor vernieuwing was. Na al die tijd was Intels bijna vanzelfsprekende voorsprong in ipc en productieproces veranderd in een achterstand, waardoor het goed zoeken was naar scenario's waarin een Ryzen 5000-cpu niet de voor de hand liggende keuze was.
Gamers als voornaamste target
Met de elfde generatie Core-processors gaat Intel op de eerste plaats achter de doelgroep aan die de cpu-ontwerper het laatst was kwijtgeraakt: gamers. Onder de slogan 'Gaming happens with Intel' wil de fabrikant gamers, een veeleisende doelgroep die bovendien bovengemiddeld veel uitgeeft aan hardware, er weer toe overhalen om voor het blauwe kamp te kiezen. Of Intel inderdaad de gamingprestatiekroon kan heroveren en of de Rocket Lake-cpu's ook voor andere doeleinden een goede keuze zijn, zoeken we uit in deze review.
De Rocket Lake-chip
De elfde generatie Intel Core-processors maakt net als de tiende generatie gebruik van socket 1200. Hoewel ze al enige tijd verkrijgbaar zijn, zijn de moederborden met een 500-serie chipset natuurlijk bedacht om met Rocket Lake te worden gecombineerd. Met een bios-update kun je de nieuwe processors ook in een H470- of Z490-moederbord gebruiken. De B460- en H410-chipsets vallen daarbij buiten de boot.
De belangrijkste vernieuwing in de Rocket Lake-chip is uiteraard de vernieuwde core. Skylake was in principe de laatste microarchitectuur die voor het 14nm-proces werd ontworpen, maar Intel heeft zijn Sunny Cove-architectuur voor 10nm gebackport. Onder de naam Cypress Cove is Sunny Cove in feite opnieuw ontworpen voor 14nm, rekening houdend met alle specificaties die een ontwerp voor het 14nm-proces kenmerken.
In totaal telt de die van een Rocket Lake-processor zes miljard transistors op een oppervlakte van 276mm², waarmee de chip aanmerkelijk groter is dan bij de vorige generaties. Saillant detail is dat hij slechts acht cores bevat, waar Comet Lake nog tien cores telde. Als Intel opnieuw een 10-core die had gemaakt, was het chipformaat dus nog een stuk groter uitgevallen. Dit geeft maar aan dat de Cypress Cove-cores door het backporten naar 14nm behoorlijk fors zijn geworden. Op de volgende pagina gaan we dieper in op alle details van Cypress Cove.
Intel heeft bij Rocket Lake niet alleen de cpu-cores op de schop genomen. Ook de geïntegreerde graphics en de controllers voor PCI-Express en het geheugen zijn grondig vernieuwd. De gpu is nu gebaseerd op de Xe-architectuur die we voor het eerst tegenkwamen in de Tiger Lake-laptopprocessors, en verdient verderop in deze review een aparte pagina.
De PCI-Express-controller in de processor heeft eindelijk een upgrade gekregen naar PCI-Express 4.0. Er gingen bij de Comet Lake-generatie al geruchten over PCIe 4.0-ondersteuning, maar om onduidelijke redenen durfde Intel dat vorig jaar nog niet aan. Hoe dan ook, nu is dat er wel en heeft Intel ook kans gezien om het aantal PCIe-lanes van de cpu te verhogen naar twintig. Zo kun je naast een videokaart (x16) ook een NVMe-ssd (x4) rechtstreeks op de processor aansluiten.
Rocket Lake heeft voor het eerst vier extra PCIe-lanes voor een M.2-ssd.
DDR4-3200 en geheugenoverclocks op midrangechipsets
Ook de geheugencontroller is vernieuwd, waarbij de officieel ondersteunde geheugensnelheid is verhoogd van 2933 naar 3200MT/s. Op papier stijgt de geheugenbandbreedte daarmee van 45,8GB/s naar 50GB/s. Er kleven echter de nodige haken en ogen aan. Zo bieden Intel-moederborden vanaf deze generatie de mogelijkheid om in gear 2 te draaien, wat betekent dat de geheugencontroller op de helft van de daadwerkelijke geheugensnelheid werkt, net zoals je bij AMD Ryzen-chips kunt kiezen tussen 1:1 en 1:2. De officiële DDR4-3200-ondersteuning in gear 1 is uitsluitend gevalideerd met een Core i9-processor, een 500-seriemoederbord met minstens zes pcb-lagen en, als je dualrankgeheugen wil gebruiken, maximaal twee modules. In de praktijk werken Intel-processors al jarenlang probleemloos op DDR4-3200 en zelfs veel hogere snelheden, zij het dat het dan officieel een overclock heet. Zolang je aan alle genoemde voorwaarden voldoet, verandert daar dus eigenlijk niets aan.
Wel heeft Intel de mogelijkheden voor het 'overklokken' van geheugen verruimd. Dat kon tot nu toe alleen met een Z-chipset, maar bij de 500-serie bieden ook B560- en H570-moederborden hier ondersteuning voor. In de praktijk is dat best een voordeel, want tot nu toe was je met zo'n moederbord gebonden aan een maximale geheugensnelheid van 2933 of zelfs 2666MT/s: een kunstmatige beperking van de processorprestaties, die er in veel applicaties toch zeker tot 3200MT/s op vooruitgaan.
500-serie chipsets: H510, B560, H570 en Z590
Hoewel ze al enige tijd verkrijgbaar zijn, herhalen we toch nog even de specificaties van de 500-seriemoederborden, juist ook omdat sommige features uitsluitend met een Rocket Lake-cpu werken. Dat is bijvoorbeeld het geval bij de verdubbelde bandbreedte van acht DMI 3.0-lanes tussen de processor en de H570- en Z590-chipsets. Alle PCIe-lanes die afkomstig zijn uit de chipset, zoals die voor extra M.2-ssd's naast het slot dat door de cpu wordt aangestuurd, werken overigens nog gewoon op 3.0-snelheid, net als bij AMD's B550-chipset bijvoorbeeld.
Verder is het nog noemenswaardig dat B560 en hoger voor het eerst enkele 20Gbit/s-USB-poorten leveren, oftewel USB 3.2 Gen2x2. Voorheen was daarvoor nog een losse controller van bijvoorbeeld ASMedia noodzakelijk. Intel noemt zelf ook Thunderbolt 4 en Wi-Fi-6E als nieuwe functies, maar in beide gevallen gaat het niet om daadwerkelijke integratie, maar slechts om ondersteuning voor additionele chips die dergelijke connectiviteit bieden.
Er liggen inmiddels al de nodige 500-seriemoederborden in het Tweakers-testlab, maar diverse moederbordfabrikanten sleutelen nog driftig aan bios-updates. Die wachten we nog even af voordat we een uitgebreide test publiceren.
Z590
Z490
H570
B560
H510
PCIe-cpu
20x PCIe 4.0
16x PCIe 3.0
20x PCIe 4.0
20x PCIe 4.0
16x PCIe 4.0
DMI
8x PCIe 3.0
4x PCIe 3.0
8x PCIe 3.0
4x PCIe 3.0
4x PCIe 3.0
PCIe-chipset
24x PCIe 3.0
24x PCIe 3.0
20x PCIe 3.0
12x PCIe 3.0
6x PCIe 3.0
USB 20Gbit/s
3
0
2
2
0
USB 10Gbit/s
7
6
2
2
0
USB 5Gbit/s
0
4
4
2
4
USB 2.0
4
4
4
6
6
USB totaal
14
14
14
12
0
SATA600
6
6
6
6
4
Hardware-RAID
Ja
Ja
Ja
Nee
Nee
CPU overklokken
Ja
Ja
Nee
Nee
Nee
Geheugen overklokken
Ja
Ja
Ja
Ja
Nee
Geheugenkanalen
2
2
2
2
1
WifI geïntegreerd
Ja, AX201
Ja, AX201
Ja, AX201
Ja, AX201
Ja, AX201
Tdp
6W
6W
6W
6W
6W
Nieuwe core: Cypress Cove
Voordat we inzoomen op de nieuwe Cypress Cove-core in de Rocket Lake-chips, is het goed om te weten waar deze naamgeving vandaan komt. Tot en met Skylake hanteerde Intel dezelfde naam voor het coreontwerp en de complete reeks processors. De Core i7 6700K was dus een Skylake-processor met Skylake-cores. In 2018 heeft Intel die naamgeving losgekoppeld; de processors blijven lakes, de cores worden vanaf nu aangeduid als cove. Op de desktop merkten we daar vooralsnog weinig van, aangezien er lange tijd geen nieuwere core dan Skylake beschikbaar was, maar dit is dus de reden dat we het nu hebben over de Rocket Lake-processors met Cypress Cove-cores.
Hoewel het ontwerp van Cypress Cove op transistorniveau compleet is overgedaan voor de 14nm-node, is de microarchitectuur identiek aan die van de Sunny Cove-core zoals die in de Ice Lake-chips op 10nm zijn gebruikt. De verder vergrote L2-cache van opvolger Willow Cove, gebruikt in Tiger Lake, heeft zijn weg dus nog niet gevonden in Cypress Cove. Dat is begrijpelijk; cache neemt relatief veel ruimte in beslag en de Cypress Cove-cores zijn per stuk al bijna een kwart groter dan een Skylake-core.
Volgens Intel biedt Cypress Cove een ipc-verbetering ten opzichte van Skylake van maximaal 19 procent; het gemiddelde zal enkele procentpunten lager liggen. Daartoe heeft de cpu-ontwerper vrijwel elk onderdeel van de core uitgebreid ten opzichte van Skylake.
Frontend: meer instructies in beeld
Voordat een x86-instructie wordt uitgevoerd door een van de rekeneenheden, wordt hij opgeknipt in micro-ops en opgeslagen in de daarvoor bedoelde queue. Micro-ops zijn simpele instructies die direct door de rekeneenheden kunnen worden uitgevoerd. Een significant deel van de micro-ops is afkomstig van de branchpredictor, die het verwerkingspad van instructies met op dat moment nog onbekende variabelen probeert te voorspellen en bij Sunny Cove een grotere nauwkeurigheid heeft. Omdat niet elke rekeneenheid elk type instructies kan verwerken, worden instructies bovendien out-of-order uitgevoerd, zodat alle rekeneenheden zoveel mogelijk beziggehouden kunnen worden.
Vrijwel alle buffers en caches die verband houden met het voorspellen van variabelen, tijdelijk opslaan van uitkomsten of juist tijdelijk terzijde stellen van instructies, zijn bij de Sunny Cove-architectuur vergroot. De micro-op-cache, de buffer die gedecodeerde instructies bewaart voor als ze nogmaals voorbijkomen, is de helft groter geworden: van 1500 micro-ops bij Haswell en Skylake naar 2250 bij Sunny Cove. Ook de buffers voor out-of-orderinstructies, loads (benodigde data voor instructies) en stores (resultaten van instructies) zijn vergroot, net als de ruimte voor scheduler-entries.
In entries, tenzij eenheid
Haswell
Skylake
Sunny Cove
Micro-op-cache
1500
1500
2250
Out-of-orderwindow
192
224
352
Loads
42
56
72
Stores
72
72
128
Scheduler
60
97
160
L1-cache (data)
32kB
32kB
48kB
L2-cache
256kB
256kB
512kB
L2-tlb (4k)
1024
1536
2048
Het resultaat van alle uitbreidingen is dat er meer instructies tegelijk kunnen worden verwerkt, waardoor de kans toeneemt dat er voor alle rekeneenheden tegelijk wat te doen is.
Bredere backend: van acht naar tien rekeneenheden
In de back-end van de core vinden we alle daadwerkelijke rekeneenheden, die worden aangeduid als poorten. Een Sunny Cove-core bevat in totaal tien poorten, wat er bij Skylake nog acht waren. Daarnaast is de functionaliteit van sommige poorten uitgebreid, waardoor ze inzetbaar zijn voor meer soorten instructies. Geheel nieuw is de ondersteuning voor avx-512-instructies, die door twee poorten kunnen worden afgehandeld.
De eerste van de twee nieuwe executionunits is een extra agu-poort, die gegevens opslaat in de L1-datacache. Ook die is bij Sunny Cove overigens groter geworden; hij telt nu 48 kilobytes, wat er bij Skylake nog 32 waren. Met de extra agu-poort beschikt elke core nu over twee load- en twee store-units, waar Skylake nog één load en twee stores had. De tweede nieuwe rekeneenheid is een store-port, die de data daadwerkelijk wegschrijft naar de door de agu aangewezen locatie.
Daarnaast zijn de bestaande rekeneenheden op diverse vlakken flexibeler geworden. Van de vier alu-poorten konden er bij Skylake nog maar twee lea-instructies uitvoeren, nu kunnen ze dat allemaal. De mogelijkheden om direct een integer te delen (iDIV) is volledig nieuw; voorheen was daar een veelvoud aan instructies voor nodig.
Nog meer dan de L1-cache is ook de L2-cache uitgebreid. Hierbij gaat het zelfs om een verdubbeling, van 256 naar 512kB per core. Inmiddels weten we dat Intel hier niet gaat stoppen, want de Willow Cove-core bevat opnieuw een (ruim) verdubbelde L2-cache, van 1,25MB per core. Om de grotere L2-cache te ondersteunen, is in Sunny Cove eveneens een grotere L2-tlb aanwezig, die plaats biedt aan maximaal 2048 4k-entries, 1024 2M/4M-entries en 1024 1G-entries.
Naast de toevoeging van avx-512-instructies aan consumenten-cpu's - serverprocessors beschikken daar al langer over - heeft Intel ondersteuning voor nog meer nieuwe instructies ingebouwd. Voor het merendeel gaat het daarbij om versnelling van cryptografische algoritmes, zoals AES en SHA. Ook kunnen diverse bewerkingen nu op verschillende getallen tegelijk worden uitgevoerd, zoals het specifiek op AI-berekeningen gerichte DLBoost.
Geïntegreerde Xe-gpu
Ook de geïntegreerde gpu is volledig vernieuwd. Het grafische gedeelte van de processor werd ten tijde van de tick-tockcadans vaak bij zowel ticks als tocks vernieuwd, waardoor we er aardig wat achter zijn gaan lopen. Met Rocket Lake gaan we in één keer van Skylakes 'gen9'-graphics naar een 'gen12'-gpu, die tot nu toe alleen in de Tiger Lake-processors is gebruikt. Om het makkelijk te houden, bevat Rocket Lake dus de processorkernen van Ice Lake met de graphics van Tiger Lake.
UHD Graphics 750 en 730
Vanzelfsprekend vinden we alle verbeteringen in de architectuur van de Xe-gpu's, zoals Intels marketingafdeling de twaalfde generatie heeft gedoopt, terug in de igpu van Rocket Lake. Wel heeft de geïntegreerde gpu van de desktopprocessors veel minder rekeneenheden: de 'UHD Graphics 750' in de luxere desktopmodellen telt 32 executionunits, tegenover 96 stuks in moderne laptopchips als de Core i7-1165G7. Bij de UHD Graphics 730 in de goedkopere i5-modellen zijn er zelfs maar 24 actief.
Videocodering en -decodering
Ten opzichte van de gen9-gpu die we tot nu toe tegenkwamen in desktop-cpu's, zijn om te beginnen de mogelijkheden voor het coderen en decoderen van media veel moderner. Video in de AV1-codec kan hardwarematig worden gedecodeerd in resoluties tot 4k met 60fps, met een maximale bitdiepte van 10. Voor de H.265- en VP9-codecs geldt zelfs een maximum van 12bit. Voor het coderen zijn de mogelijkheden beperkt tot 10bit-4k met 60fps voor HEVC en VP9. AV1-codering wordt nog niet ondersteund.
DisplayPort 1.4, HDMI 2.0 en Adaptive Sync
Het uitsturen van het videosignaal kan naar maximaal drie monitoren, die je kunt aansluiten via DisplayPort 1.4 of HDMI 2.0. Afhankelijk van de specificaties van de gekozen standaard, kan dat in resoluties tot 5k met 60fps en hdr. Bovendien wordt Adaptive Sync ondersteund, dat door respectievelijk AMD en Nvidia wordt vermarkt als FreeSync en G-Sync Compatible. Aangezien je met een geïntegreerde gpu vaak geen enorm hoge framerates haalt, kan dat een uitkomst zijn.
Xe-architectuur
Kijken we meer in detail naar de rekeneenheden van de geïntegreerde videochip, dan zien we dat de interne indeling ten opzichte van oudere generaties flink op de schop is gegaan. In de frontend van de executionunits wordt de threadcontrol tussen twee eu's gedeeld, waar iedere unit bij gen11 nog zijn eigen aansturing had. Kijken we naar de daadwerkelijke rekeneenheden, dan had de gen11-architectuur vier alu's die overweg konden met floatingpoint- en integerberekeningen, en vier alu's die floatingpoint- en extended-mathbewerkingen konden uitvoeren. Dat complete concept is vervangen door acht alu's voor zowel floatingpoint- als integerberekeningen, aangevuld met twee alu's die puur voor extended math dienen. Aan de complete gpu zijn verder nieuwe L1-caches per subslice van zestien eu's en een gedeelde L3-cache van maximaal 16MB toegevoegd.
Line-up en prijzen
De elfde generatie Core-processors voor desktops bestaat in totaal uit dertig modellen, waarvan het topmodel i9 11900K acht cores telt, twee minder dan de 10900K. Alleen de Core i5-, i7- en i9-modellen maken gebruik van de nieuwe Rocket Lake-chip; de Core i3's en Pentiums zijn een simpele rebrand van Comet Lake. Vooralsnog profiteer je dus alleen van de nieuwe architectuur als je ten minste ongeveer 150 euro uitgeeft aan een processor.
Core i9's met Adaptive Boost Technology
De kloksnelheden van de processors verdienen enige toelichting, want de turboboost van Intels processors is bij de afgelopen generaties steeds ingewikkelder geworden. Laten we het topmodel Core i9 11900K als voorbeeld nemen. De basiskloksnelheid van deze processor is 3,5GHz, maar dankzij Turbo Boost 2.0 kunnen de kloksnelheden oplopen tot 5,1GHz voor maximaal twee cores, 5,0GHz voor maximaal vier cores, 4,8GHz voor maximaal zes cores en 4,7GHz als alle rekenkernen worden belast.
Daarmee missen we nog 200MHz ten opzichte van de hieronder vermelde singlecoreboost en zelfs 400MHz voor de allcoreboost. Voor de singlecoreboost spelen twee extra boosts een rol: Turbo Boost Max 3.0 kan de twee 'beste' cores 100MHz hoger laten klokken, terwijl ook Thermal Velocity Boost 100MHz kan toevoegen. Voor TVB geldt wel een maximumtemperatuur van 70 graden, maar deze 100MHz-boost is dan ook actief ongeacht het aantal belaste cores. Voor de allcoreboost speelt naast TVB ook de compleet nieuwe Adaptive Boost Technology een rol, die de maximale snelheid zonder restrictie voor de chiptemperatuur verhoogt met 300MHz. Overigens worden alle turbo's gedeactiveerd als de processor een temperatuur van honderd graden bereikt, maar dat is niet meer dan logisch.
ABT is uitsluitend beschikbaar voor de twee overklokbare Core i9-modellen, de Core i9 11900K en de 11900KF zonder igpu. Vermoedelijk heeft Intel deze cpu's behoorlijk goed uitgezocht, want bij de geheugencontroller waren het ook alleen deze twee processors waarvoor Intel de hoogste specificaties opgaf.
Core i7 en i5
Tegelijk is ATB een broodnodige manier om de i9's te differentiëren van de i7's, die door de teruggang in het aantal cores van de topmodellen nu evenveel cores hebben. Op papier verschilt de Core i7 11700K daardoor alleen wat de kloksnelheden betreft van de 11900K; de tweaker zal dat al gauw 140 gemakkelijk verdiende euro's vinden. De tdp is met 125W gelijk, maar bedenk dat Intel die berekent met de basiskloksnelheid. Tijdens het boosten mag het verbruik van de '125W-cpu's' oplopen tot 251W, al lappen retailmoederborden dergelijke limieten doorgaans volledig aan hun laars.
Tot slot de Core i5 11600K, die net als zijn voorganger zes cores telt en daarom ook wat minder cache heeft. Het verschil met de Core i5 11500 betreft alleen de overklokbaarheid en de kloksnelheden. Bij de goedkopere i5 11400 heeft Intel bovendien een deel van de geïntegreerde gpu uitgeschakeld, waardoor nog maar 24 van de 32 executionunits actief zijn.
Core
Kloksnelheid base / allcore- / singlecoreboost
Cores / threads
L3-cache
Tdp
OC
Ram
Gpu
Prijs
Core i9-11900K
Cypress Cove
3,5GHz / 5,1GHz / 5,3GHz
8/16
16MB
125W
Ja
DDR4-3200
UHD Graphics 750
€ 548
Core i9-11900KF
Cypress Cove
3,5GHz / 5,1GHz / 5,3GHz
8/16
16MB
125W
Ja
DDR4-3200
n.v.t.
€ 521
Core i9-11900
Cypress Cove
2,5GHz / 4,7GHz / 5,2GHz
8/16
16MB
65W
Nee
DDR4-3200
UHD Graphics 750
€ 446
Core i9-11900F
Cypress Cove
2,5GHz / 4,7GHz / 5,2GHz
8/16
16MB
65W
Nee
DDR4-3200
n.v.t.
€ 429
Core i9-11900T
Cypress Cove
1,5GHz / 3,7GHz / 4,9GHz
8/16
16MB
35W
Nee
DDR4-3200
UHD Graphics 750
€ 446
Core i7-11700K
Cypress Cove
3,6GHz / 4,6GHz / 5GHz
8/16
16MB
125W
Ja
DDR4-3200
UHD Graphics 750
€ 406
Core i7-11700KF
Cypress Cove
3,6GHz / 4,6GHz / 5GHz
8/16
16MB
125W
Ja
DDR4-3200
n.v.t.
€ 380
Core i7-11700
Cypress Cove
2,5GHz / 4,4GHz / 4,9GHz
8/16
16MB
65W
Nee
DDR4-3200
UHD Graphics 750
€ 328
Core i7-11700F
Cypress Cove
2,5GHz / 4,4GHz / 4,9GHz
8/16
16MB
65W
Nee
DDR4-3200
n.v.t.
€ 303
Core i7-11700T
Cypress Cove
1,4GHz / 3,6GHz / 4,6GHz
8/16
16MB
35W
Nee
DDR4-3200
UHD Graphics 750
€ 328
Core i5-11600K
Cypress Cove
3,9GHz / 4,6GHz / 4,9GHz
6/12
12MB
125W
Ja
DDR4-3200
UHD Graphics 750
€ 266
Core i5-11600KF
Cypress Cove
3,9GHz / 4,6GHz / 4,9GHz
6/12
12MB
125W
Ja
DDR4-3200
n.v.t.
€ 241
Core i5-11600
Cypress Cove
2,8GHz / 4,3GHz / 4,8GHz
6/12
12MB
65W
Nee
DDR4-3200
UHD Graphics 750
€ 216
Core i5-11600T
Cypress Cove
1,7GHz / 3,5GHz / 4,1GHz
6/12
12MB
35W
Nee
DDR4-3200
UHD Graphics 750
€ 216
Core i5-11500
Cypress Cove
2,7GHz / 4,2GHz / 4,6GHz
6/12
12MB
65W
Nee
DDR4-3200
UHD Graphics 750
€ 195
Core i5-11500T
Cypress Cove
1,5GHz / 3,4GHz / 3,9GHz
6/12
12MB
35W
Nee
DDR4-3200
UHD Graphics 750
€ 195
Core i5-11400
Cypress Cove
2,6GHz / 4,2GHz / 4,4GHz
6/12
12MB
65W
Nee
DDR4-3200
UHD Graphics 730
€ 185
Core i5-11400F
Cypress Cove
2,6GHz / 4,2GHz / 4,4GHz
6/12
12MB
65W
Nee
DDR4-3200
n.v.t.
€ 160
Core i5-11400T
Cypress Cove
1,3GHz / 3,3GHz / 3,7GHz
6/12
12MB
35W
Nee
DDR4-3200
UHD Graphics 730
€ 185
Core i3-10325
Skylake
3,9GHz / 4,5GHz / 4,7GHz
4/8
8MB
65W
Nee
DDR4-2666
UHD Graphics 630
€ 157
Core i3-10305
Skylake
3,8GHz / 4,3GHz / 4,5GHz
4/8
8MB
65W
Nee
DDR4-2666
UHD Graphics 630
€ 145
Core i3-10305T
Skylake
3GHz / 3,7GHz / 4GHz
4/8
8MB
35W
Nee
DDR4-2666
UHD Graphics 630
€ 145
Core i3-10105
Skylake
3,7GHz / 4,2GHz / 4,4GHz
4/8
6MB
65W
Nee
DDR4-2666
UHD Graphics 630
€ 124
Core i3-10105F
Skylake
3,7GHz / 4,2GHz / 4,4GHz
4/8
6MB
65W
Nee
DDR4-2666
n.v.t.
€ 99
Core i3-10105T
Skylake
3GHz / 3,6GHz / 3,9GHz
4/8
6MB
35W
Nee
DDR4-2666
UHD Graphics 630
€ 124
Pentium Gold G6605
Skylake
4,3GHz / n.v.t./ n.v.t.
2/4
4MB
65W
Nee
DDR4-2666
UHD Graphics 630
€ 87
Pentium Gold G6505
Skylake
4,2GHz / n.v.t./ n.v.t.
2/4
4MB
65W
Nee
DDR4-2666
UHD Graphics 630
€ 76
Pentium Gold G6505T
Skylake
3,6GHz / n.v.t./ n.v.t.
2/4
4MB
35W
Nee
DDR4-2666
UHD Graphics 630
€ 76
Pentium Gold G6405
Skylake
4,1GHz / n.v.t./ n.v.t.
2/4
4MB
65W
Nee
DDR4-2666
UHD Graphics 610
€ 65
Pentium Gold G6405T
Skylake
3,5GHz / n.v.t./ n.v.t.
2/4
4MB
35W
Nee
DDR4-2666
UHD Graphics 610
€ 65
Testverantwoording
Voor deze review van Intels Rocket Lake-processors hebben we alle relevante processors uit de 10-serie en natuurlijk de Ryzen 5000-processor volledig opnieuw getest. Dat doen we met onderstaande testsystemen. Vanzelfsprekend hebben we voor de tests, die allemaal in de voorbije twee weken hebben plaatsgevonden, alle nieuwste bios-, microcode- en software-updates toegepast.
De mainstreamplatforms geven we 16GB per geheugenkanaal, dus in totaal 32GB, terwijl we de HEDT-platforms met 32GB per kanaal uitrusten, wat in de praktijk op 128GB uitkomt. De kloksnelheid stellen we in op de officiële maximumsnelheid, zoals opgegeven door AMD of Intel.
Bij processors met een geïntegreerde gpu draaien we het gros van onze benchmarks zonder extra videokaart, terwijl we cpu's zonder igpu, zoals de meeste AMD Ryzens en Intel F-modellen, combineren met een Nvidia GeForce GTX 1650.
Gametests
Alle gamebenchmarks draaien we in combinatie met een van de snelste videokaarten van dit moment, een Nvidia GeForce RTX 3080. Dat doen we primair in full-hd-resolutie, 1920x1080 pixels, met Medium- en Ultra-settings. We kiezen juist voor de relatief lage full-hd-resolutie om de cpu waar mogelijk de bottleneck te laten zijn. Dit blijft representatief als er in de toekomst snellere videokaarten verschijnen die de bottleneck laten verschuiven naar de processor. Bij hogere resoluties, zoals 4k, ligt de bottleneck vooralsnog vaak bij de videokaart. Om dit te illustreren, draaien we twee games op beide resoluties.
Stroomverbruik
Uiteraard meten we ook het stroomverbruik van de processors. Onze meetmethode daarvoor is gebaseerd op de stroom die door de EPS- en ATX-kabels naar het moederbord loopt en die we onderscheppen met behulp van Tinkerforge-hardware. Door uitsluitend het vermogen van de processor te meten, geïsoleerd van de rest van het systeem, kunnen we een appels-met-appelsvergelijking maken. Daarbij rapporteren we de mediaan van zowel het verbruik via de EPS-kabels, cpu-only, als het totale verbruik inclusief het moederbord. We noteren het stroomverbruik idle, gemiddeld over vijf minuten, en tijdens twee soorten belasting. Een is met een Cinebench R20-run, multithreaded uiteraard, en de ander tijdens het renderen van een video in Adobe Premiere Pro.
Welke testgegevens het relevantst zijn voor jou, verschilt naargelang je gebruiksdoel. Installeer je als gamer bijvoorbeeld toch al een losse videokaart, dan is het vergelijken van puur het cpu-verbruik de meest logische route. Zou je daarentegen genoeg hebben aan geïntegreerde graphics of moet je cpu's die dat niet hebben, voorzien van een videokaart om beeld te krijgen, dan kan het totale platformverbruik relevanter zijn.
Ipc-test
We trappen af met de ipc-test, waarbij we de ruwe snelheid van de processorarchitectuur in instructions per clock proberen te vangen. Hiertoe stellen we alle processors in op dezelfde kloksnelheid van 2,4GHz en exact gelijke geheugensettings: DDR4-2666 met cl14. Vervolgens draaien we de singlethreaded test van Cinebench 15, een van de meestgebruikte processorbenchmarks. Aangezien de test singlethreaded en op een vaste kloksnelheid is, maakt het in principe niet uit op welke cpu binnen een serie je hem draait, zolang de interne opbouw gelijk is.
Op de vaste kloksnelheid noteert de Core i9 11900K een score van 119 punten, ruim 14 procent hoger dan zijn voorloper, de 10900K. Die sprong is groot genoeg om de Ryzen 3000-serie in te halen, maar de 11900K komt nog rond de 10 procent tekort om de nieuwste AMD-processors bij te benen.
Foto- en videobewerking
Fotobewerking testen we met het Adobe Photoshop CC-pakket, dat zo populair is dat 'fotoshoppen' als werkwoord de Van Dale heeft bereikt. We draaien een opgeslagen 'action', of 'handeling' in de Nederlandstalige versie, die diverse soorten effecten, bewerkingen en transformaties bevat.
In Adobe Premiere Pro CC renderen en exporteren we een videoproject. Het bronproject is een Tweakers Tech Hub-aflevering, bestaande uit 4k-camerabeelden, die we exporteren met een variabele bitrate van 20 tot 40Mbit/s. De speelduur van de video is 13m 51s.
In DaVinci Resolve renderen we een video opnieuw naar 4k met de H.264-codec. De bronbestanden zijn vier streams van 1080p die in een mozaïek worden samengevoegd tot een enkele 4k-stream. De bitrate ligt met 80Mbit/s flink hoger dan bij Premiere en uiteraard worden ook weer effecten als kleurcorrectie en camerastabilisatie toegepast.
In Photoshop zijn de nieuwe Intels duidelijk sneller dan hun voorgangers. Afhankelijk van het model zien we prestatiewinsten tussen de 3 en 10 procent. De 11900K boekt de kleinste winst, want die levert natuurlijk twee cores in.
In Premiere Pro doet de nieuwe serie het een stuk beter, met winsten die regelmatig de 20 procent naderen. De Core i9 11900K is daarmee sneller dan het 8-corealternatief van AMD, de Ryzen 7 5800X. De Ryzen 9's blijven wel nog vlotter.
DaVinci Resolve is van oudsher het domein van de AMD Ryzen-processors. Daar verandert weinig in, maar de nieuwe Intels naderen de AMD-chips wel een stuk dichter dan bij de voorgaande generaties het geval was.
Video- en audiocodering
Op deze pagina vind je de prestaties tijdens het omzetten van video en audio. De H.264- en HEVC-codecs testen we met de StaxRip-encoder. In beide gevallen converteren we een mp4-video van 1080p met een framerate van 60fps. In de tweede benchmark converteren we dezelfde video met behulp van de H.265-codec. Beide benchmarks voeren we drie keer uit, waarna we de gemiddelde score noteren. Voor de audioconversie zetten we een FLAC-bestand van een uur om in een WAVE en noteren we de tijd die dit kost.
Bij het coderen met de x264-codec zijn de Core i5 11600K en i7 11700K rond de 20 procent sneller dan hun directe voorlopers. De Core i9 weet maar een procent of 10 te winnen; dergelijke workloads weten immers vrij goed gebruik te maken van veel cores. In de x265-test zijn de verschillen veel kleiner en weet de i9 11900K ternauwernood beter te presteren dan de 10900K.
Audioconversie is geheel singlethreaded, waardoor de Intels profiteren van hun nieuwe architectuur en hun hoge kloksnelheden. De Core i9 11900K weet in te breken in het Ryzen 5000-bastion, door net wat sneller te zijn dan de Ryzen 5 5600X. De i5 en i7 lukt dat niet, maar ze blijven wel beter presteren dan de volledige 10-serie.
3d-rendering
Cinebench is de benchmarksoftware die hoort bij de Cinema4D-rendersoftware. Je kunt deze benchmark gratis downloaden en eenvoudig zelf draaien, in zowel single- als multithreaded modus. Mede daardoor is hij uitgegroeid tot een van de populairste cpu-tests.
Met een Cinebench 20-singlescore van 631 punten weet Intel de singlethreaded prestatiekroon niet af te pakken van AMD. Wel evenaart de nieuwe processor hiermee de Ryzen 9 5900X. De 11700K en 11600K komen net onder de 600 punten uit en moeten daarmee hun meerdere erkennen in de Ryzen 5 5600X.
In de multithreaded score zijn de ipc-winst en hogere kloksnelheid net genoeg om de score van de 10900K te overtreffen, hoewel de 11900K twee cores minder heeft. Bij de i5 en de i7 is niet aan het aantal cores gesleuteld, waardoor ze mooie winsten van rond de 14 procent laten noteren. De 11600K haalt daarmee de Ryzen 5 3600 in; de 11700K nadert hooguit de Ryzen 7 5800X wat dichter.
Blender is een opensource-renderengine. Met deze software renderen we het Barcelona Pavillion-project, dat je hier kunt downloaden.
In Blender blijft de Core i9 10900K net-aan de snelste Intel-chip in de grafieken. In verhouding wint de 11700K het meest ten opzichte van zijn voorganger. Net als in Cinebench zien we de Core i5 11600K de Ryzen 5 3600 voorbijstreven.
Corona Renderer is een renderengine die beschikbaar is in Autodesk 3DS Max en Maxon Cinema 4D. Wij draaien de officiële Corona Benchmark, waarin een voorgedefinieerde scène wordt gerenderd. Je kunt de benchmark zelf gratis downloaden.
Corona geeft dan weer de eer aan de 11900K, die een seconde sneller klaar is dan de 10900K. De 11700K is ruim 15 procent sneller dan de 10700K; de i5 weet daarentegen maar weinig winst te boeken.
Fusion 360 is een softwarepakket dat je onder meer kunt gebruiken voor 3d-modelling en voor cad/cam-werkzaamheden of het ontwerpen van pcb's. Het is afkomstig uit de stallen van Autodesk, maar gratis te gebruiken door particulieren. Wij renderen een van de vele beschikbare modellen: een Raspberry Pi 4 B. Daarbij renderen we het ontwerp in 4k-resolutie en in de hoogst mogelijke kwaliteit.
In Fusion 360 profiteren de nieuwe processors flink van hun hogere ipc. Zowel de i9 als de i7 verslaat de Ryzen 7 5800X. De i5 blijft juist wat achter, waarvoor we niet direct een verklaring hebben, maar ook bij opnieuw testen blijft dit consequent zo.
Compute en encryptie
We draaien de AIDA64-benchmarksuite integraal. Daarin komen diverse soorten computeworkloads en encryptiemethodes voor. Waar mogelijk worden instructiesetuitbreidingen als SSE en AVX ingezet. Verder meet dit programma hoe snel SHA-3-hashes kunnen worden berekend. Het hele testparcours draaien we drie keer om eventuele variatie in resultaten op te vangen.
Zlib
AES
Hash
SHA-3
Julia
Mandel
Fp32-raytrace
Fp64-raytrace
AIDA64 - Zlib
Processor
Gemiddelde doorvoersnelheid in MB/s (hoger is beter)
In sommige deeltests, zoals de AES-, hashing- en SHA3-benchmarks, scoren de nieuwe cpu's stukken beter dan hun voorgangers. Meer dan de 'gewone' hogere ipc spelen hier de nieuwe mogelijkheden van de Cypress Cove-cores een rol. Die cores bevatten optimalisaties voor bepaalde algoritmes. Zeker in de AES- en SHA3-tests is Intel daardoor weer in staat om te concurreren met de AMD Ryzen-chips, die op dit vlak een enorme voorsprong hadden genomen.
Webbrowsing en compressie
In de populairste webbrowser van dit moment, Google Chrome, draaien we de Jetstream-benchmark. Die kun je zelf terugvinden via browserbench.org. Vrijwel alle deeltests worden 120 keer gedraaid en de scores worden gemiddeld en gewogen. We voeren deze benchmark uit in de Chrome 86.
Dankzij de hogere singlethreaded prestaties zijn de Rocket Lake-processors in deze test flink sneller dan de op Skylake gebaseerde chips. De Core i9 11900K perst er een score van 204 punten uit, waarmee hij koploper is. De 11700K en 11600K sluiten net achter de Ryzen 5000-processors aan.
Met 7-Zip comprimeren we 4GB aan bestanden met behulp van de 'fast compression'-instellingen tot een 7z-bestand en noteren we de tijd. We berekenen het gemiddelde van drie runs.
De resultaten in 7-Zip zijn minder rooskleurig voor de elfde generatie chips. Alleen de i7 11700K presteert iets beter dan zijn voorganger; de Core i5 en i9 worden er juist langzamer op.
Games: geïntegreerde gpu
Voordat we gaan kijken naar de prestaties met een losse videokaart, draaien we enkele tests met de geïntegreerde gpu. Om te beginnen 3DMark's Night Raid, een synthetische benchmark gericht op igpu's, die gebruikmaakt van DirectX 12.
De geïntegreerde graphics van Intel-processors stonden lange tijd stil, maar in 3DMark Night Raid maakt de nieuwe serie een mooie sprong. De nieuwe igpu is bijna 50 procent sneller als we naar de totaalscore kijken, of zelfs iets meer bij de pure Graphics-score, die op bijna 10.500 punten uitkomt. We hebben de AMD-apu's niet opnieuw getest voor deze review, maar ter referentie: een Ryzen 5 3400G haalde in onze recentste review een Graphics-score van 15.600 punten. Zo snel als de AMD-gpu's is Intel dus nog niet.
Ook in racegame F1 2020 is de nieuwe generatie Intel-processors flink sneller. Op Low-settings komt de geïntegreerde gpu tot 45fps, met Medium-settings is dat bijna 35fps. Zeker in combinatie met Adaptive Sync kun je daarmee best een aardig potje racen, mits je niet te veeleisend bent.
Tot slot lukt het de elfde generatie Core-chips om de 60fps-grens in Total War: Troy te doorbreken, op 720p-resolutie en met lage instellingen. Het opschroeven van de resolutie naar full hd heeft flinke gevolgen, waarbij de framerate ruwweg door de helft gaat.
Games: Red Dead Redemption 2
We benchmarken Red Dead Redemption 2, gebruikmakend van de Vulkan-api. Dit is een van de games die we behalve in full hd ook in 4k-resolutie draaien.
1920x1080 - Medium
1920x1080 - Medium (99p)
1920x1080 - Medium (99.9p)
1920x1080 - Ultra
1920x1080 - Ultra (99p)
1920x1080 - Ultra (99.9p)
Red Dead Redemption 2 - 1920x1080 - Medium - Vulkan
In Red Dead Redemption 2 presteren de nieuwe processors dramatisch. Ze zijn veel langzamer dan de tiende generatie Core-cpu's en al helemaal dan de Ryzen 5000-processors. Dit lijkt specifiek in deze game te spelen. We hebben onze bevindingen gedeeld met Intel en zijn in afwachting van een reactie.
3840x2160 - Medium
3840x2160 - Medium (99p)
3840x2160 - Medium (99.9p)
3840x2160 - Ultra
3840x2160 - Ultra (99p)
3840x2160 - Ultra (99.9p)
Red Dead Redemption 2 - 3840x2160 - Medium - Vulkan
Op 4k-resolutie meten we amper verschillen tussen de processors, maar zelfs hier blijven de nieuwe chips iets achter.
Games: Metro Exodus
In Metro Exodus dansen de nieuwe processors een beetje om hun voorgangers heen. Afhankelijk van de settings zijn ze soms iets sneller, soms iets langzamer, maar de Ryzen 5000-processors van AMD blijven duidelijk het snelst. De frametimes schetsen nog een iets minder positief beeld dan de framerates.
In Total War: Troy zijn de nieuwe chips wel duidelijk sneller dan de tiende generatie. Op Ultra-settings verslaan de Core i7 en i9 zelfs een groot deel van de Ryzen 5000-processors, helemaal als we naar de frametimes kijken.
F1 2020 is een grafisch weinig intensieve racegame, waardoor een snellere processor al gauw prestatiewinst oplevert. De AMD Ryzen 5000-chips blijven duidelijk sneller in deze test, al winnen de Intels vooral op Ultra-settings wel iets ten opzichte van hun voorgangers. De Core i5 11600K profiteert verhoudingsgewijs het meest.
De laatste game die we benchmarken, is Far Cry: New Dawn. In dit spel hadden de Ryzen 5000-processors de overhand, maar daar weet de Core i9 11900K toch iets aan te doen. Op Medium nestelt hij zich midden in de AMD-line-up, op Ultra-settings klimt hij zelfs naar de tweede plek. De Core i5 en i7 zijn op hun beurt ook wat sneller dan hun voorlopers, maar het verschil is niet groot genoeg om tussen de recentste AMD-chips terecht te komen.
In de streamingtest coderen we een videobestand met de x264-codec terwijl het spel F1 2020 draait op een vaste snelheid van 60fps, om zo het streamen van gameplay te simuleren. Hiervoor gebruiken we de 'very fast'-kwaliteitsinstelling van de codec, met een bitrate van 6Mbit en een framerate van 60fps. We rapporteren een gemiddelde van drie runs. In feite geeft deze test een indicatie van hoeveel rekenkracht een processor nog over heeft naast het draaien van een game.
AMD was al een tijd heer en meester in deze test. Intel weet met de Core i9 11900K en de i7 11700K op z'n minst één Ryzen 5000-processor te verschalken: de 5600X. Vooral voor de i7 is dat een flinke sprong ten opzichte van zijn voorganger: hij is 23 procent sneller dan de 10700K.
Streaming (x264 6Mbit + F1 2020 1080p ultra 60fps)
In de Tweakers CPU Gaming Prestatiescore berekenen we een gewogen gemiddelde van alle gamingtests op full-hd-resolutie, exclusief de streamingtest.
In de gamingtests lieten de nieuwe Intel-processors een wisselend beeld zien. Soms zijn ze sneller dan de 10-serie, vaak ongeveer net zo snel en alleen in Red Dead Redemption 2 zagen we juist een fors prestatieverlies. Dat laatste is hopelijk een oplosbare uitschieter, maar beïnvloedt natuurlijk wel de index. Over het algemeen zouden we stellen dat de Rocket Lake-processors vergelijkbaar presteren met de 10-serie, en soms wat beter, maar het niet halen bij de Ryzen 5000-chips van AMD.
Het meten van het stroomverbruik is vaak voer voor discussie in de reacties. Om je zoveel mogelijk context te bieden, rapporteren we het verbruik via de EPS-kabels (cpu-only) en via de ATX-kabel (moederbord). Over het algemeen omvat dat laatste de chipset, het geheugen en waar van toepassing de stroom die de videokaart uit het PCIe-slot trekt. Bij sommige platforms wordt een secundaire rail van de processor, zoals de Vsoc, via de ATX-stekker gevoed, waardoor het interessant wordt om het totale verbruik te bekijken.
Welke testgegevens het relevantst zijn voor jou, verschilt naargelang je gebruiksdoel. Installeer je als gamer bijvoorbeeld toch al een losse videokaart, dan is het vergelijken van puur het cpu-verbruik de meest logische route. Zou je daarentegen genoeg hebben aan geïntegreerde graphics of moet je cpu's die dat niet hebben, voorzien van een videokaart om beeld te krijgen, dan kan het totale platformverbruik relevanter zijn.
Stroomverbruik idle
Intel was tot nu toe de koning van zuinigheid in idle, maar dat blijkt nu anders te liggen. Waar menig model van de vorige generatie onder de 1,5W dook, verbruiken de i5 en i7 nu ongeveer 3,7W in idle, vergelijkbaar met wat veel van de Ryzen 5000-chips doen. De Core i9 11900K gaat zelfs niet lager dan 7W. Als je je pc 24/7 aan laat staan, kost puur het hogere idleverbruik ten opzichte van de 10900K je 10 euro extra op jaarbasis.
Onder belasting wordt duidelijk dat Intel alle teugels heeft losgelaten wat het stroomverbruik betreft. De Core i9 11900K verbruikt ruim 297W; inclusief het moederbord wordt de grens van 300W overschreden. De 11700K verbruikt 177W, waarbij in elk geval het verschil met de voorganger een stuk kleiner is. In relatieve zin kent de Core i5 11600K de grootste toename, van 97W voor de 10600K naar 136W voor zijn opvolger. Dat is 40 procent meer en praktisch het niveau van de meest luxe Ryzens.
Adobe Premiere Pro maakt tot op zekere hoogte goed gebruik van veel cores, maar niet onbeperkt. De agressieve extra boost die Intel last minute aan de Core i9 11900K heeft toegevoegd, heeft tot gevolg dat de processor in dit scenario extreem veel energie gebruikt. Onze meting komt uit op 248W, ruim 70 procent meer dan de 10900K. De Core i7 11700K verbruikt met 151W nog altijd meer dan het topmodel van de vorige generatie en de 6-core-i5 11600K met 123W bijna net zoveel als de Ryzen 9 5900X met dubbel zoveel rekenkernen.
Om te bepalen hoe efficiënt een processor werkt, meten we de totale hoeveelheid energie die een processor nodig heeft om de Cinebench R20 MT-benchmark af te ronden. In dit resultaat spelen dus zowel de tijd die de processor nodig heeft, en daarmee de prestaties, als het stroomverbruik een rol. De multithreaded test van Cinebench schaalt vrijwel perfect naar processors met veel cores.
Het recept voor een efficiënte processor is primair het hebben van veel cores, liefst op een niet al te hoge kloksnelheid. De Core i9 11900K is het tegenovergestelde van die definitie, waardoor hij maar liefst 4,39Wh verbruikt om de Cinebench R20 MT-benchmark te voltooien. De 11700K en 11600K komen net onder de 3Wh uit. Ter vergelijking: de Ryzen 5000-chips zitten tussen de 1,43 en 2,19Wh.
Stroomverbruik Cinebench R20 - CPU + moederbord - Totaal
De temperaturen van de processors testen we met een be quiet Dark Rock Pro 4, een van de best presterende luchtkoelers die je kunt kopen. In het luxere segment is hij dan ook een van de populairste koelers in de Pricewatch.
Om te waarborgen dat de geboden koeling altijd identiek is en de temperaturen van verschillende processors dus vergelijkbaar zijn, laten we de ventilators van de koeler altijd op volle snelheid (12 volt) draaien. De gebruikte belasting is een vijftien minuten durende loop van Cinebench 20 multithreaded. We loggen elke seconde de temperatuur van de cpu-package, de kloksnelheid (effectief de allcoreturbo) en het stroomverbruik, allemaal gebaseerd op de sensors die in de processor zelf zijn verwerkt.
Temperatuur
Kloksnelheid
Package power
De Intel Core i9 11900K is de eerste processor die zelfs met de ventilators op volle draaisnelheid niet voldoende gekoeld wordt om throttling te voorkomen. Al na enkele seconden begint de processor te throttlen, maar het duurt anderhalve minuut voordat de temperatuur en kloksnelheid helemaal gestabiliseerd zijn. We noteren een maximumtemperatuur van 94 graden en een gemiddelde kloksnelheid van 4,95GHz; de officiële allcoreturbo is 5,1GHz. Je kunt gerust stellen dat deze processor zonder waterkoeling eigenlijk niet afdoende te koelen valt; daarvoor is de hoeveelheid hitte op de relatief kleine oppervlakte van een socket 1200-processor simpelweg te extreem.
Ook de Core i7 11700K en i5 11600K worden iets warmer dan hun voorgangers. Bij de 11700K blijft het verschil beperkt tot 2 graden, bij de 11600K loopt de temperatuur 10 graden verder op.
Om een beeld te geven van de prijs-prestatieverhouding, hebben we het aantal Cinebench 20 MT-punten gedeeld door de prijs van de processors. Voor de nieuwe serie Intel-processors hanteren we de adviesprijzen; de scores van de oudere processors hebben we berekend op basis van de laagste Pricewatch-prijzen.
Over het algemeen hebben de nieuwe processors een slechtere prijs-prestatieverhouding dan hun voorgangers. Vooral de Core i9 11900K levert weinig waar voor zijn geld, alleen AMD's amper verkrijgbare topmodel komt nog lager uit. Nu moeten we wel zeggen dat de 10-serie hier vooral komt bovendrijven doordat deze processors sinds hun release flink in prijs zijn gezakt, wat ook geldt voor de oudere Ryzen 3000-serie van AMD.
Hieronder vergelijken we de nieuwe Intel Core i5 11600K rechtstreeks met zijn voorganger, de Core i5 10600K, en zijn voornaamste concurrent, de AMD Ryzen 5 5600X. Deze processors hebben allemaal zes cores, maar de Ryzen 5 5600X is wel flink duurder.
Intel Core i5 11600K
Intel Core i5 10600K
Ryzen 5 5600X
Configuratie
6C/12T
6C/12T
6C/12T
Prijs
€ 266
€ 220
€ 349
De Core i5 11600K heeft net zoveel cores als zijn voorganger, maar wel de nieuwe architectuur en iets hogere kloksnelheden. In alle cpu-tests behalve Fusion 360 en 7-Zip presteert hij dan ook beter dan de 10600K. Gemiddeld komen we uit op 32 procent, maar de enorme winsten in sommige AIDA-tests vertekenen het beeld. Laten we die weg, dan is de Core i5 11600K gemiddeld 10 procent sneller dan zijn voorganger. Wel blijft de Core i5 11600K nog 7 procent achter bij de AMD Ryzen 5 5600X.
Cpu-benchmarks
Intel Core i5 11600K
Intel Core i5 10600K
AMD Ryzen 5 5600X
vs. 10600K
vs. 5600X
Cinebench 20 ST
577cb
485cb
598cb
19%
-4%
Cinebench 20 MT
4021cb
3537cb
4360cb
14%
-8%
Blender
647 sec.
706 sec.
571 sec.
8%
-13%
Fusion 360
318 sec.
300 sec.
316 sec.
-6%
-1%
CoronaRender
134 sec.
137 sec.
116 sec.
2%
-16%
Adobe Photoshop
149 sec.
160 sec.
124 sec.
7%
-20%
Adobe Premiere Pro
642 sec.
773 sec.
559 sec.
17%
-15%
DaVinci Resolve
526 sec.
778 sec.
414 sec.
32%
-27%
FLAC
149 sec.
168 sec.
139 sec.
11%
-7%
Staxrip - x264
196,66fps
167,74fps
213,35fps
17%
-8%
Staxrip - x265
76,71fps
69,45fps
83,23fps
10%
-8%
Chrome
187.509
165.441
192.621
13%
-3%
7-Zip
127 sec.
112 sec.
108 sec.
-13%
-18%
AIDA64 - Zlib
680MB/s
603MB/s
698MB/s
13%
-3%
AIDA64 - AES
123702MB/s
30517MB/s
108647MB/s
305%
14%
AIDA64 - Hash
15861MB/s
7740MB/s
25121MB/s
105%
-37%
AIDA64 - SHA3
4002MB/s
2800MB/s
2762MB/s
43%
45%
AIDA64 - Julia
57753
57099
80735
1%
-28%
AIDA64 - Mandel
35700
30053
44212
19%
-19%
AIDA64 - FP32 Raytrace
14496
11875
12924
22%
12%
AIDA64 - FP64 Raytrace
8029
6565
6792
22%
18%
Gemiddeld
32%
-7%
Gemiddeld excl. AIDA64
10%
-11%
Gemiddeld is de igpu 40 procent sneller geworden, met een uitschieter naar 70 procent hogere prestaties in F1 2020 op Medium-settings.
IGP-benchmarks
Intel Core i5 11600K
Intel Core i5 10600K
vs. 10600K
3DMark Night Raid
10810
7096
52%
3DMark Night Raid - Graphics
10436
6636
57%
F1 2020 - 1280x720 - Low
44,8fps
27,7fps
62%
F1 2020 - 1280x720 - Low (99p)
35,3ms
50,3ms
30%
F1 2020 - 1280x720 - Medium
34,5fps
20,3fps
70%
F1 2020 - 1280x720 - Medium (99p)
46,8ms
67,8ms
31%
Total War: Troy - 1280x720 - Low
67,2fps
46,3fps
45%
Total War: Troy - 1280x720 - Low (99p)
21,12ms
28,64ms
26%
Total War: Troy - 1920x1080 - Low
32,9fps
23,8fps
38%
Total War: Troy - 1920x1080 - Low (99p)
59,39ms
54,55ms
-9%
Gemiddeld
40%
In F1 2020, Total War: Troy en Far Cry: New Dawn is de Core i5 11600K wat sneller dan de 10600K; in Metro Exodus zijn vooral de frametimes minder goed. Red Dead Redemption 2 laat een grote achteruitgang zien, wat overigens voor de hele elfde generatie Core-chips geldt. Op full-hd-resolutie presteert de Core i5 11600K gemiddeld 5 procent slechter dan de 10600K en 20 procent minder goed dan de Ryzen 5 5600X. Als we de uitschieter Red Dead Redemption 2 niet meenemen, zou hij juist 3 procent sneller zijn dan zijn voorganger, en zou het verschil met AMD teruglopen naar 12 procent.
Gamebenchmarks
Intel Core i5 11600K
Intel Core i5 10600K
AMD Ryzen 5 5600X
vs. 10600K
vs. 5600X
RDR2 - 1920x1080 - Medium - Vulkan
112,2fps
136,3fps
162,6fps
-18%
-31%
RDR2 - 1920x1080 - Medium - Vulkan (99p)
16,44ms
10,12ms
8,82ms
-62%
-86%
RDR2 - 1920x1080 - Ultra - Vulkan
106,9fps
126,2fps
131,8fps
-15%
-19%
RDR2 - 1920x1080 - Ultra - Vulkan (99p)
16,64ms
10,85ms
9,68ms
-53%
-72%
RDR2 - 3840x2160 - Medium - Vulkan
81,6fps
87,3fps
87,5fps
-7%
-7%
RDR2 - 3840x2160 - Medium - Vulkan (99p)
20,56ms
14,15ms
14,09ms
-45%
-46%
RDR2 - 3840x2160 - Ultra - Vulkan
72fps
72,7fps
73,5fps
-1%
-2%
RDR2 - 3840x2160 - Ultra - Vulkan (99p)
20,63ms
16,81ms
16,5ms
-23%
-25%
Metro Exodus - 1920x1080 - Medium
162,1fps
158,9fps
186,6fps
2%
-13%
Metro Exodus - 1920x1080 - Medium (99p)
13,19ms
12,24ms
12ms
-8%
-10%
Metro Exodus - 1920x1080 - Ultra
120,1fps
120,5fps
127,3fps
0%
-6%
Metro Exodus - 1920x1080 - Ultra (99p)
17,48ms
14,77ms
15,92ms
-18%
-10%
Metro Exodus - 3840x2160 - Medium
96fps
98,4fps
96,5fps
-2%
-1%
Metro Exodus - 3840x2160 - Medium (99p)
20,7ms
18,11ms
18,87ms
-14%
-10%
Metro Exodus - 3840x2160 - Ultra
66,6fps
68,5fps
67fps
-3%
-1%
Metro Exodus - 3840x2160 - Ultra (99p)
26,78ms
23,54ms
25,16ms
-14%
-6%
Total War: Troy - 1920x1080 - Medium
298,8fps
275,3fps
371,9fps
9%
-20%
Total War: Troy - 1920x1080 - Medium (99p)
5,05ms
5,58ms
3,9ms
9%
-29%
Total War: Troy - 1920x1080 - Ultra
127,5fps
115,9fps
135,9fps
10%
-6%
Total War: Troy - 1920x1080 - Ultra (99p)
11,06ms
13,36ms
12,63ms
17%
12%
F1 2020 - 1920x1080 - Medium
250,8fps
235,6fps
307,1fps
6%
-18%
F1 2020 - 1920x1080 - Medium (99p)
6,1ms
6,5ms
5,2ms
6%
-17%
F1 2020 - 1920x1080 - Ultra
186,5fps
172,1fps
219,6fps
8%
-15%
F1 2020 - 1920x1080 - Ultra (99p)
8,1ms
8,7ms
7,1ms
7%
-14%
Far Cry: New Dawn - 1920x1080 - Medium
135,5fps
124,9fps
144,9fps
8%
-6%
Far Cry: New Dawn - 1920x1080 - Medium (99p)
11,77ms
10,84ms
9,54ms
-9%
-23%
Far Cry: New Dawn - 1920x1080 - Ultra
116,8fps
109,7fps
127,1fps
6%
-8%
Far Cry: New Dawn - 1920x1080 - Ultra (99p)
13,7ms
13,16ms
12,09ms
-4%
-13%
Streaming (x264 6Mbit + F1 2020 1080p ultra 60fps)
143,06fps
124,45fps
161,61fps
15%
-11%
Gemiddeld (1080p)
-5%
-20%
De Intel Core i5 11600K verbruikt flink meer stroom dan zijn voorloper. Het idle-verbruik valt flink hoger uit en is niet langer in het voordeel van Intel, maar ook onder belasting verbruikt de 11600K bijna het dubbele van de 5600X.
Stroomverbruik
Intel Core i5 11600K
Intel Core i5 10600K
AMD Ryzen 5 5600X
vs. 10600K
vs. 5600X
Idle
3,7W
1,3W
3,6W
-173%
-1%
Cinebench R20 MT
136,4W
97,1W
70,4W
-40%
-94%
Premiere Pro
123,2W
85,2W
68,4W
-45%
-80%
Core i7 11700K vs. Ryzen 7 5800X en i7 10700K
Hieronder vergelijken we de nieuwe Intel Core i7 11700K rechtstreeks met zijn voorganger, de Core i7 10700K, en zijn voornaamste concurrent, de AMD Ryzen 7 5800X. Deze processors hebben allemaal acht cores. De AMD Ryzen 7 5800X is vier tientjes duurder, de 10700K is inmiddels juist flink in prijs gedaald en daardoor 75 euro goedkoper.
Intel Core i7 11700K
Intel Core i7 10700K
Ryzen 7 5800X
Configuratie
8C/16T
8C/16T
8C/16T
Prijs
€ 406
€ 330
€ 449
De Intel Core i7 11700K wint behalve in de AIDA-test Julia álle benchmarks van zijn voorganger. Gemiddeld gebeurt dat met 14 procent verschil, of 31 procent als we de extreme verbeteringen in enkele specifieke AIDA-tests meerekenen. Gemiddeld blijft de Ryzen 7 5800X wel 8 procent sneller.
CPU-benchmarks
Intel Core i7 11700K
Intel Core i7 10700K
AMD Ryzen 7 5800X
vs. 10700K
vs. 5800X
Cinebench 20 ST
593cb
513cb
623cb
16%
-5%
Cinebench 20 MT
5576cb
4910cb
6033cb
14%
-8%
Blender
450 sec.
530 sec.
416 sec.
15%
-8%
Fusion 360
224,3 sec.
268 sec.
229 sec.
16%
2%
CoronaRender
91 sec.
107 sec.
85 sec.
15%
-7%
Adobe Photoshop
113 sec.
126 sec.
100 sec.
10%
-13%
Adobe Premiere Pro
548 sec.
640 sec.
548 sec.
14%
0%
DaVinci Resolve
510 sec.
784 sec.
286 sec.
35%
-78%
Flac
147 sec.
157 sec.
134 sec.
6%
-10%
Staxrip - x264
227,6fps
190,78fps
243,24fps
19%
-6%
Staxrip - x265
86,97fps
80,37fps
98,71fps
8%
-12%
Chrome
188.763
167.288
203.372
13%
-7%
7-Zip
78 sec.
81 sec.
90 sec.
4%
13%
AIDA64 - Zlib
903MB/s
837MB/s
950MB/s
8%
-5%
AIDA64 - AES
164919MB/s
42552MB/s
148146MB/s
288%
11%
AIDA64 - Hash
21147MB/s
10785MB/s
33918MB/s
96%
-38%
AIDA64 - SHA3
5334MB/s
3903MB/s
3908MB/s
37%
36%
AIDA64 - Julia
77001
79536
112938
-3%
-32%
AIDA64 - Mandel
47590
41852
61709
14%
-23%
AIDA64 - FP32 Raytrace
19319
16521
18563
17%
4%
AIDA64 - FP64 Raytrace
10704
9063
9850
18%
9%
Gemiddeld
31%
-8%
Gemiddeld excl. AIDA64
14%
-11%
De igpu presteert 41 procent beter.
IGP-benchmarks
Intel Core i7 11700K
Intel Core i7 10700K
vs. 10700K
3DMark Night Raid
10950
7218
52%
3DMark Night Raid - Graphics
10435
6643
57%
F1 2020 - 1280x720 - Low
44,6fps
27,5fps
62%
F1 2020 - 1280x720 - Low (99p)
34,1ms
51,6ms
34%
F1 2020 - 1280x720 - Medium
34fps
20,1fps
69%
F1 2020 - 1280x720 - Medium (99p)
47,2ms
68,3ms
31%
Total War: Troy - 1280x720 - Low
69,6fps
46fps
51%
Total War: Troy - 1280x720 - Low (99p)
22,21ms
29,03ms
23%
Total War: Troy - 1920x1080 - Low
33,8fps
24,5fps
38%
Total War: Troy - 1920x1080 - Low (99p)
57,06ms
52,57ms
-9%
Gemiddeld
41%
Red Dead Redemption 2 laat dramatische scores noteren, maar staat daarin grotendeels alleen. Laten we die game weg uit de berekening, dan is de 11700K 2 procent sneller dan de 10700K, anders moeten we een verlies van 6 procent noteren. De Ryzen 7 5800X is flink sneller; niet alleen in RDR2, maar ook in andere games zien we regelmatig scores die 10 tot 20 procent hoger uitvallen.
Gamebenchmarks
Intel Core i7 11700K
Intel Core i7 10700K
AMD Ryzen 7 5800X
vs. 10700K
vs. 5800X
RDR2 - 1920x1080 - Medium - Vulkan
121fps
149,3fps
167,5fps
-19%
-28%
RDR2 - 1920x1080 - Medium - Vulkan (99p)
14,96ms
9,26ms
8,24ms
-62%
-82%
RDR2 - 1920x1080 - Ultra - Vulkan
113,2fps
131,4fps
133,1fps
-14%
-15%
RDR2 - 1920x1080 - Ultra - Vulkan (99p)
15,51ms
10,05ms
9,67ms
-54%
-60%
RDR2 - 3840x2160 - Medium - Vulkan
84,3fps
87fps
86,9fps
-3%
-3%
RDR2 - 3840x2160 - Medium - Vulkan (99p)
19ms
14,45ms
14,47ms
-31%
-31%
RDR2 - 3840x2160 - Ultra - Vulkan
71,7fps
72,6fps
72,3fps
-1%
-1%
RDR2 - 3840x2160 - Ultra - Vulkan (99p)
21,95ms
17,03ms
16,89ms
-29%
-30%
Metro Exodus - 1920x1080 - Medium
168,6fps
168,4fps
192,7fps
0%
-13%
Metro Exodus - 1920x1080 - Medium (99p)
12,56ms
12,56ms
11,31ms
0%
-11%
Metro Exodus - 1920x1080 - Ultra
122,9fps
125,3fps
127,6fps
-2%
-4%
Metro Exodus - 1920x1080 - Ultra (99p)
16,49ms
15,14ms
15,51ms
-9%
-6%
Metro Exodus - 3840x2160 - Medium
95,1fps
100,1fps
96,1fps
-5%
-1%
Metro Exodus - 3840x2160 - Medium (99p)
19,75ms
18,12ms
18,33ms
-9%
-8%
Metro Exodus - 3840x2160 - Ultra
66,3fps
68,7fps
67fps
-3%
-1%
Metro Exodus - 3840x2160 - Ultra (99p)
24,17ms
24,05ms
22,87ms
0%
-6%
Total War: Troy - 1920x1080 - Medium
332,1fps
298,8fps
387,6fps
11%
-14%
Total War: Troy - 1920x1080 - Medium (99p)
4,22ms
4,8ms
3,55ms
12%
-19%
Total War: Troy - 1920x1080 - Ultra
136,7fps
122,7fps
139,1fps
11%
-2%
Total War: Troy - 1920x1080 - Ultra (99p)
9,88ms
12,28ms
12,03ms
20%
18%
F1 2020 - 1920x1080 - Medium
258,5fps
269,8fps
336,2fps
-4%
-23%
F1 2020 - 1920x1080 - Medium (99p)
6ms
5,6ms
4,9ms
-7%
-22%
F1 2020 - 1920x1080 - Ultra
191,7fps
191,1fps
226,4fps
0%
-15%
F1 2020 - 1920x1080 - Ultra (99p)
8,1ms
7,9ms
6,9ms
-3%
-17%
Far Cry: New Dawn - 1920x1080 - Medium
140,5fps
135,7fps
149,4fps
4%
-6%
Far Cry: New Dawn - 1920x1080 - Medium (99p)
9,59ms
9,47ms
9,13ms
-1%
-5%
Far Cry: New Dawn - 1920x1080 - Ultra
123,2fps
118,6fps
128,1fps
4%
-4%
Far Cry: New Dawn - 1920x1080 - Ultra (99p)
11,77ms
11,93ms
11,48ms
1%
-3%
Streaming (x264 6Mbit + F1 2020 1080p ultra 60fps)
179,48fps
145,92fps
185,86fps
23%
-3%
Gemiddeld (1080p)
-6%
-17%
In relatieve zin is de toename van het stroomverbruik bij de Core i7 11700K het laagst, al verbruikt hij in bijvoorbeeld Premiere Pro wel de helft meer dan de 5800X van AMD.
Stroomverbruik
Intel Core i7 11700K
Intel Core i7 10700K
AMD Ryzen 7 5800X
vs. 10700K
vs. 5800X
Idle
3,6W
1,3W
3,9W
-171%
7%
Cinebench R20 MT
177,1W
161,6W
132,5W
-10%
-34%
Premiere Pro
151,2W
122,2W
101,2W
-24%
-49%
Core i9 11900K vs. Ryzen 9 5900X en i9 10900K
Hieronder vergelijken we de nieuwe Intel Core i9 11900K rechtstreeks met zijn voorganger, de Core i9 10900K, en zijn voornaamste concurrent, de AMD Ryzen 9 5900X. De Core i9 11900K heeft twee cores minder dan de 10900K en zelfs vier minder dan de Ryzen 9 5900X. Hoewel de adviesprijs van 569 euro van dat laatste model vergelijkbaar is, ligt de 5900X door zijn slechte verkrijgbaarheid voor hogere prijzen in de winkels.
Intel Core i9 11900K
Intel Core i9 10900K
Ryzen 9 5900X
Configuratie
8C/16T
10C/20T
12C/24T
Prijs
€ 548
€ 469
€ 629
Dankzij de hoge klokfrequenties en de nieuwe architectuur presteert de Core i9 11900K erg goed in singlethreaded benchmarks. In Cinebench evenaart hij de score van de Ryzen 9 5900X, en ook in tests als Chrome en FLAC weet hij dicht in de buurt te komen. In multithreaded tests zijn de betere per-coreprestaties daarentegen amper voldoende om het gemis van twee extra cores goed te maken, zoals in Cinebench, Blender, Photoshop en x265. Gemiddeld is de 11900K 20 procent sneller dan de 10900K, of 10 procent als we de AIDA-tests niet meenemen. De Ryzen 9 5900X blijft in beide gevallen ongeveer 23 procent sneller.
Cpu-benchmarks
Intel Core i9 11900K
Intel Core i9 10900K
AMD Ryzen 9 5900X
vs. 10900K
vs. 5900X
Cinebench 20 ST
631cb
508cb
631cb
24%
0%
Cinebench 20 MT
6343cb
6227cb
8368cb
2%
-24%
Blender
427 sec.
423 sec.
295 sec.
-1%
-45%
Fusion 360
201 sec.
232 sec.
162,4 sec.
13%
-24%
CoronaRender
82 sec.
83 sec.
58 sec.
1%
-41%
Adobe Photoshop
106,5 sec.
110 sec.
85 sec.
3%
-25%
Adobe Premiere Pro
519 sec.
643 sec.
500 sec.
19%
-4%
DaVinci Resolve
493 sec.
776 sec.
242 sec.
36%
-104%
Flac
138 sec.
154 sec.
133 sec.
10%
-4%
Staxrip - x264
235,09fps
213,19fps
272,76fps
10%
-14%
Staxrip - x265
91,65fps
90,12fps
110,6fps
2%
-17%
Chrome
204.671
176.499
191.649
16%
7%
7-Zip
75 sec.
71 sec.
68 sec.
-6%
-10%
AIDA64 - Zlib
995MB/s
1086MB/s
1343MB/s
-8%
-26%
AIDA64 - AES
175578MB/s
55800MB/s
212019MB/s
215%
-17%
AIDA64 - Hash
23471MB/s
14037MB/s
48535MB/s
67%
-52%
AIDA64 - SHA3
5567MB/s
5082MB/s
5270MB/s
10%
6%
AIDA64 - Julia
80378
101470
154376
-21%
-48%
AIDA64 - Mandel
49650
47623
83481
4%
-41%
AIDA64 - FP32 Raytrace
20304
17696
24271
15%
-16%
AIDA64 - FP64 Raytrace
11014
9553
12983
15%
-15%
Gemiddeld
20%
-24%
Gemiddeld excl. AIDA64
10%
-23%
De geïntegreerde graphics presteren gemiddeld 41 procent beter dan bij de 10900K.
IGP-benchmarks
Intel Core i9 11900K
Intel Core i9 10900K
vs. 10900K
3DMark Night Raid
10817
7349
47%
3DMark Night Raid - Graphics
10239
6737
52%
F1 2020 - 1280x720 - Low
45,5fps
35,6fps
28%
F1 2020 - 1280x720 - Low (99p)
35,1ms
37ms
5%
F1 2020 - 1280x720 - Medium
34,9fps
20,2fps
73%
F1 2020 - 1280x720 - Medium (99p)
47,5ms
67,1ms
29%
Total War: Troy - 1280x720 - Low
69,7fps
46,6fps
50%
Total War: Troy - 1280x720 - Low (99p)
20,38ms
28,98ms
30%
Total War: Troy - 1920x1080 - Low
36,7fps
24,4fps
50%
Total War: Troy - 1920x1080 - Low (99p)
30,41ms
53,16ms
43%
Gemiddeld
41%
Gemiddeld meten we 8 procent slechtere prestaties in games, maar dat is vrijwel geheel te wijten aan de opvallend slechte scores in RDR2. Als we die weglaten, zou de 11900K juist 1 procent sneller zijn. Dan zou bovendien het verschil met de Ryzen 9 5900X gemarginaliseerd worden.
Gamebenchmarks
Intel Core i9 11900K
Intel Core i9 10900K
AMD Ryzen 9 5900X
vs. 10900K
vs. 5900X
RDR2 - 1920x1080 - Medium - Vulkan
123,3fps
156,8fps
170,2fps
-21%
-28%
RDR2 - 1920x1080 - Medium - Vulkan (99p)
15,73ms
9,21ms
8,25ms
-71%
-91%
RDR2 - 1920x1080 - Ultra - Vulkan
113,1fps
132,1fps
133fps
-14%
-15%
RDR2 - 1920x1080 - Ultra - Vulkan (99p)
16,44ms
9,95ms
9,91ms
-65%
-66%
RDR2 - 3840x2160 - Medium - Vulkan
84,6fps
87,6fps
87,3fps
-3%
-3%
RDR2 - 3840x2160 - Medium - Vulkan (99p)
19,2ms
14,25ms
14,21ms
-35%
-35%
RDR2 - 3840x2160 - Ultra - Vulkan
72fps
73fps
73,3fps
-1%
-2%
RDR2 - 3840x2160 - Ultra - Vulkan (99p)
22,12ms
16,94ms
16,95ms
-31%
-31%
Metro Exodus - 1920x1080 - Medium
177,4fps
180,6fps
187,2fps
-2%
-5%
Metro Exodus - 1920x1080 - Medium (99p)
11,84ms
10,98ms
10,83ms
-8%
-9%
Metro Exodus - 1920x1080 - Ultra
123,8fps
130,4fps
126,7fps
-5%
-2%
Metro Exodus - 1920x1080 - Ultra (99p)
16,02ms
15,2ms
16,62ms
-5%
4%
Metro Exodus - 3840x2160 - Medium
96,1fps
99,3fps
96,6fps
-3%
-1%
Metro Exodus - 3840x2160 - Medium (99p)
19,03ms
17,9ms
17,77ms
-6%
-7%
Metro Exodus - 3840x2160 - Ultra
66,8fps
68,8fps
66,8fps
-3%
0%
Metro Exodus - 3840x2160 - Ultra (99p)
24,34ms
22,26ms
22,93ms
-9%
-6%
Total War: Troy - 1920x1080 - Medium
343,3fps
326,9fps
396,6fps
5%
-13%
Total War: Troy - 1920x1080 - Medium (99p)
4,09ms
4,33ms
3,225ms
6%
-27%
Total War: Troy - 1920x1080 - Ultra
139,7fps
126,1fps
143,9fps
11%
-3%
Total War: Troy - 1920x1080 - Ultra (99p)
9,45ms
12,39ms
11,23ms
24%
16%
F1 2020 - 1920x1080 - Medium
269,2fps
288,2fps
347,5fps
-7%
-23%
F1 2020 - 1920x1080 - Medium (99p)
5,8ms
5,4ms
4,7ms
-7%
-23%
F1 2020 - 1920x1080 - Ultra
197,9fps
195,5fps
229,5fps
1%
-14%
F1 2020 - 1920x1080 - Ultra (99p)
7,7ms
7,8ms
6,4ms
1%
-20%
Far Cry: New Dawn - 1920x1080 - Medium
147fps
144,7fps
152,3fps
2%
-3%
Far Cry: New Dawn - 1920x1080 - Medium (99p)
9,21ms
9,25ms
8,76ms
0%
-5%
Far Cry: New Dawn - 1920x1080 - Ultra
129,4fps
124fps
131,6fps
4%
-2%
Far Cry: New Dawn - 1920x1080 - Ultra (99p)
11,2ms
11,34ms
11,37ms
1%
1%
Streaming (x264 6Mbit + F1 2020 1080p ultra 60fps)
182,24fps
160,35fps
207,95fps
14%
-12%
Gemiddeld (1080p)
-8%
-16%
De Intel Core i9 10900K was al geen zuinige processor, maar de 11900K verbruikt nog eens een klap meer energie. In Cinebench hikt onze stroommeter tegen de 300W aan; in Premiere Pro blijft het verbruik met bijna 250W erg hoog. Opvallend is ook dat Intel zijn traditionele voorsprong als het op idle-verbruik aankwam, inruilt voor een achterstand.
Stroomverbruik
Intel Core i9 11900K
Intel Core i9 10900K
AMD Ryzen 9 5900X
vs. 10900K
vs. 5900X
Idle
7,1W
2,0W
4,2W
-260%
-67%
Cinebench R20 MT
297,3W
221,0W
137,3W
-35%
-117%
Premiere Pro
248,1W
144,4W
125,5W
-72%
-98%
Conclusie
Rocket Lake geeft Intel een broodnodige boost om weer enigszins competitief te zijn met AMD's Ryzen 5000-processors. Voor het eerst in zes jaar kan Intel de ipc van zijn desktopprocessors verhogen, dankzij het backporten van de Sunny Cove-architectuur naar het 14nm-proces. Die backport heeft ook nadelen; de cores zijn per stuk maar liefst een kwart groter dan de Skylake-kernen die tot nu toe gebruikt werden, waardoor de Rocket Lake-chip erg groot is en het maximale aantal cores moest worden teruggeschroefd.
Prestaties en gaming
Het topmodel Core i9 11900K, dat niet langer tien, maar acht cores telt, raakt zijn ipc-winst in multithreaded tests daardoor gelijk weer kwijt. Als we de spectaculaire scores bij algoritmes als AES en SHA3 even buiten beschouwing laten, is de 11900K gemiddeld maar 10 procent sneller dan zijn voorloper.
Ook in games is het beeld niet louter positief. Hier en daar weet Intel substantiële vooruitgang te boeken, zoals in de streamingtest, maar sommige games lijken nog niet optimaal gebruik te maken van de vernieuwde architectuur en laten juist lagere framerates zien. De echte uitschieters kunnen vast worden gepatcht, maar over het algemeen zijn de gameprestaties hooguit een kleine stap vooruit, niet groot genoeg om de AMD Ryzen 5000-processors bij te benen.
De Core i5 11600K en i7 11700K kampen niet met een teruggang in het aantal cores, waardoor de prestatieverbetering bij die modellen beter tot zijn recht komt. In beide gevallen is de directe concurrent van AMD wel sneller, maar ook duurder, waardoor de Intels niet per se een slechte deal zijn.
Het energiegebruik loopt uit de klauwen
De olifant in de kamer is het energiegebruik van de nieuwe processors, met de Core i9 11900K voorop. Het topmodel verbruikt onder volle belasting bijna 300W, een waarde zoals we die eigenlijk alleen kennen van de beruchte AMD FX-9000-serie. Voor zover dergelijke getallen niet voor zich spreken: de Ryzen 9 5950X werkt driemaal zo efficiënt als Intels nieuwe topmodel. Serieuze koeling en een moederbord met een stevige vrm zijn dus een must. De Core i5 en i7 verbruiken lang niet zoveel, maar zijn nog altijd veel minder zuinig dan de concurrentie.
Kleine vooruitgang, grote compromissen
Onder de streep verandert de introductie van de elfde generatie Core-processors weinig aan de status quo op de processormarkt. AMD's Ryzen-processors blijven de beste keuze voor het merendeel van de pc-bouwers, terwijl de Intels een rol blijven spelen in hun bestaande niches, zoals wanneer je de (sterk verbeterde) geïntegreerde gpu wil gaan gebruiken. Intel kan dankzij de vernieuwde architectuur van de Rocket Lake-processors iets beter concurreren, maar zolang dat nog op de 14nm-node moet, worden de noodzakelijke compromissen alleen maar groter.
Vooralsnog blijft de nieuwe generatie Intel-processors dus verstoken van awards. Toch hebben we de hoop nog niet volledig opgegeven. Op papier lijkt de scherp geprijsde Core i5 11400 een interessante chip, met een minder extreem stroomverbruik dan de nu geteste K-modellen, maar wel met alle verbeteringen van de nieuwe architectuur. Als het goed is, arriveert deze processor dinsdag nog in ons testlab, dus we komen spoedig bij je terug met onze ervaringen.
De rollen zijn nu dus echt omgedraaid - op de desktop.
Daar waar de wat meer ervaren Tweakers met AMD fetish nog weten dat Intel op een gegeven moment afstand nam op IPC en efficienter energie verbruik, zie je dat AMD die kaarten nu na een hele lange tijd weer in handen heeft.
Wat uiteindelijk het allermooiste van deze situatie is, is dat er en weer wat te kiezen is en een reus als Intel gedwongen wordt daadwerkelijk te innoveren.
En 300Watt voor een desktop CPU is, zeker in combinatie met stroomverbruik van GPU's, bizar.
Vanuit bedrijfsperspectief natuurlijk logisch, ze zijn de beste en ze weten het maar al te goed....
Tja, lijkt me inderdaad logisch. Nu, zo overdreven vind ik de prijzen nu ook weer niet. De 5800x presteert 8% beter dan de i7 11700k, het prijsverschil is 43€.
De i7-11700K is met de huidige prijs geen aanrader, dan zou ik eerder voor de i9-10850K gaan, sneller & goedkoper dan de 5800X en i7-11700K. Nadeel: wel een hoger stroomverbruik dan de 5800X.
De i9 gaat je op jaarbasis wel wat extra aan stroom kosten.
Stel je gamed 2 uur per dag. Je hebt de i9 met een energie verbruik dat 0,2 kwh hoger dan AMD. 365 dagen lang. Tegen een energie tarief van 0,21 euro.
2 × 0,2 × 365 × 0,21 = 30,66
Als je een flinke gamer bent kan dit wel eens dubbel dat bedrag worden. Wanneer je de zelfde PC ook voor werk doeleinden gebruikt zal het natuurlijk nog wat hoger liggen.
Als je 2 uur per dag gamed en 4 jaar wil doen met de processor , dan ben je dus zo 120 euro verder in stroom kosten.
Die 5900x wordt toch wel snel aantrekkelijker als je dit in ogenschouw neemt.
Check even de review van Hardware Unboxed. Die 10900K doet tijdens een gaming workload net zoveel systeemverbruik als een systeem mer 5600X. De 5800X komt er zelfs een stuk boven.
Het viel me al op met m'n eigen 10850K dat het stroomverbruik onder gaming workloads erg beschaaft is; 60-80 watt is vrij gebruikelijk.
Heb hier (in een ander systeem) een 5600X gehad en die deed 75W bij een GPU stresstest; wanneer de cpu eigenlijk niks te doen heeft.
Ik zie eerlijk gezegd, afgezien van de wat duurdere moederborden geen reden meer om niet voor 10th gen Intel te gaan. Zeker als de B560 (met geheugen OC) straks breed verkrijgbaar zijn voor redelijke prijzen.
Bouw zelf systemen en ben AMD ook eerlijk gezegd behoorlijk beu. De 5700 serie gpu's was een groot debacle met stabiliteit, van de 3000 serie zijn er grote hoeveelheden defecte processors uitgeleverd, de 5000 serie cpu's worden belachelijk heet zonder een high-tier koeler en dan nog de eeuwig aanhoudende usb-problemen die computers gewoon onbespeelbaar maken... Maar dan wel bijna 400 euro vragen voor de goedkoopste processor.
Gelukkig doen ze het met de 6000 videokaarten gelukkig wel een stuk beter.
Heb nu een systeem met 5950x op watercooling z73 nxzt.
Haal 50-60°c onder load, stabiel en geen probleem met usb poorten.
Tja dat is mijn ervaring, en het lijkt me ook dat je mss niet beseft dat de ryzen 5xxx series gemaakt zijn om ook heter te worden dan de vorige generaties cpu...
Maw hier is voor gekozen in design, en je moet afstappen van je coole temperatuur cpu fetish want dit is gewoon andere architectuur bedoeld om heter te draaien dan de vorige cpu...maar dat hebben de meeste blijkbaar niet begrepen omdat ze nog altijd niet door hebben dat dit de BEDOELING is...
gewoon mijn ervaring met amd...en ik besef dat het ook anders kon maar dat is het dus niet.
"je moet afstappen van je coole temperatuur cpu fetish"
AMD heeft een statement gedaan waarin het stelt dat 'operating temps' van 90-95 graden binnen spec zijn en niet schadelijk.
Een 5600X met PBO aan, iets wat in de meeste moederborden standaard aan staat, boost zichzelf naar tijdens gaming ook makkelijk naar deze 90+ graden. Wat ook standaard is bij veel moederborden dat je bij dit soort temperaturen weinig controle over je fan hebt. In sommige gevallen was de max safe temp 85, daarna gaat de fan automatisch op 100%. Met een stockkoeler, maar ook met menig andere koeler, is dit niet om aan te horen.
Ik snap dat er op Tweakers veel mensen zijn als jij of "Sietse Vliegen" die gerust duizend euro of in jouw geval zelfs flink meer dan dat uitgeven aan een processor en koeloplossing, maar er is een hele grote groep mensen die een stuk minder te besteden hebben.
Met PBO uit is het gelukkig al een stuk beter te doen, maar zelf lever ik geen 5600X met stock koeler. Voor het totaalplaatje zit je dan al op bijna 400 euro voor cpu+koeler voor AMD midrange. Dat is gewoon high-end geld vragen voor midrange.
Toen de i9 10850K in een upgrade set van Alternate omgerekend zo'n 380 euro was, was voor mij de keuze in ieder geval makkelijk. Dit was mijn route:
Alles is duurder geworden, daar kan je niet naast kijken.
Heb zelf een upgrade gedaan van een i5 4690k naar een 5950x
Heb met mijn vorige build toch wel 5-6 jaar gedaan..
Ben zelf niet iemand die upgrade voor 10% of 30% performance tov kostprijs.
Dus ja...als mijn vorige build 1200€ heeft gekost gespreid over 5-6 jaar, is dat gewoon 200€ ongeveer per jaar. En das is niet duur voor een hobby...vind ik persoonlijk..Er zijn hobby die dat bedrag om de paar maanden vereisen..
Ook deze nieuwe build met 5950x+3070 rtx+watercooling etc kostprijs +/- 2500€.
Verwacht ik toch wel de komende 8 jaar zoet mee te zijn. datis dan 300€ per jaar ongeveer. oftewel 25€ per maand.
Zo denk ik dan en dan doet het gewoon minder pijn...lange termijn visie
Normaal is mijn max budget voor 3d kaarten altijd 400-450 geweest, en dat ging altijd goed voor een high mid range kaart.
Maar tijden veranderen blijkt, en het zou me niet verbazen dat de high mid range kaarten vanaf nu gewoon standaard 600-900€ gaan kosten. We gaan denk ik nooit meer de prijzen van 2000-2015 zien.
Mede ook omdat er gewoon continu geld wordt bijgedrukt door de ECB en de US central bank en dit eenmaal in de wereld economie komt dus de waarde van geld gaat naar beneden, dus om dit te corrigeren moeten de prijzen omhoog...behalve onze lonen...en dat is het probleem...
Geld is in waarde aan het zakken, en je moet gewoon meer hebben van hetzelfde om aan dezelfde waarde te komen. Het is een complex systeem en alles samen zorgt dit voor een hele wisselende markt.
Deze keer zijn het de compûter chips etc, volgende keer mss ons eten, waar de vraag hoogst is, daar zal je dan weer extra inflatie zien in prijzen.
Dus gebruik allemaal jullie verstand en gebruik je geld wijs...
Zorg dat je niet in de problemen komt, en verwissel niet te vaak NEED met GREED..
Koop alleen eerst het nodige...
Een 5600X met PBO aan, iets wat in de meeste moederborden standaard aan staat
Dat zou standaard nooit aan moeten staan want het laat de CPU tot (bijna) zijn maximum overclocken. Heel gek is het dus niet dat hij dan met de standaard koeler richting de 90 graden gaat.
Afhankelijk van je wensen zijn er tussen de 200 en 400 euro meerdere goede opties van zowel Intel als AMD, dus kies vooral wat voor jouw budget en wensen het beste is, maar je hebt echt geen dure waterkoeling nodig voor een 5600X, of zelfs een 5900X.
Blaas je de problemen niet een beetje op? Heb je ze zelf ervaren of herhaal je wat anderen zeggen?
Ik bouw ook zelf al mijn PC’s. Na 6 keer intel heb ik nu voor het eerst sinds tijden weer een AMD build.
Mijn 5900x met Noctua D15 is 100% stabiel, wordt max 70c onder full load en heeft geen enkel probleem met USB. Met een stock cooler van een 3900X was hij fractioneel warmer, maar verder nog steeds prima. (de noctua is alleen een stuk stiller)
Ik heb meer dan 50 systemen gebouwd met de Ryzen 2000 serie, zo'n 20-30 met de Ryzen 3000 en vanwege om meerdere redenen (weinig videokaarten, weinig waar voor je geld, relatief veel stabiliteitsissues) maar 4-5 pc's met de Ryzen 5000 serie.
De 5900X is één van de betere cpu's uit de serie, want maar 6 actieve cores per CCX (of hoe het nu ook heet) en in theorie relatief veel waar voor je geld. Omdat de meeste games niet eens 6 cores volledig benutten kan de workload over goed beide CCX'en gespreid worden en dat zie je ook in de temps terug. Een 5800X met hogere boost en 8 cores op maar één CCX wordt een stuk warmer dan menig 5900X.
De meeste (of eigenlijk alle) usb-problemen zitten in de aansturing van usb 2.0. Ik heb de problemen zelf op één B450 bord gehad en twee B550 borden. Zodra je overschakelt naar 3.0 zijn de problemen weg. Fijn als je genoeg 3.0 poorten hebt voor je behoeften, een constant haperende pc als je toch ook 2.0 nodig hebt.
AMD erkent de problemen en heeft onlangs weer een nieuwe Agesa uitbracht die soelaas moet bieden. De vorige deden dat niet; hopelijk nu wel.
Ik vond dat ze echt heel tof bezig waren en heb met ontzettend veel plezier Ryzen 2600 en 2700X pc's in elkaar gezet, maar AMD heeft de prestatiekroon dus ze hoeven niet meer; en dat merk je meteen. Gelukkig maakt Intel pas op de plaats en hebben ze nu een zeer aantrekkelijk aanbod op de instap en midrange. Niet dat er überhaupt veel pc's nu in elkaar gezet worden.
Mee eens. Je hebt gelijk, vooral wat betreft de interessante keuze om voor een 10th gen te gaan als de upgrade de moeite is, en zeker niet gaan voor de 11th gen!
Ik heb deed dit, omdat ik wist dat de Rocket Lake een flop zou zijn, en eigenlijk niet nodig was om ui t te brengen :-D
10850k 10c/20t Jeeeehaaa!!! Minstens 4j zoet met een high - end gpu.
Dit kan niemand tegenspreken, enkel degenen die graag en onnodig om de 2j ofzo een nieuwe systeem wensen, terwijl ze deze eigenlijk niet noodzakelijk is en weinig snelheidswinst zullen maken.
Als je een flinke gamer bent juist niet, het stroomverbruik in games van de i9-10850K en i9-10900K is afhankelijk van de game vergelijkbaar / zelfs iets lager dan dat van de 5900X:
De 5800X is wel iets zuiniger, maar zoals je ziet, heel veel verschil maakt het ook niet.
Kijk het probleem van de Hardware.info / Tweakers.net testen is dat ze wel de prestaties in games weergeven maar vervolgens niet het stroomverbruik in games.
Ah okee ik las in de conclusie van het artikel dat de 5950x 3 keer zo efficiënt is als de Intel. Ik dacht dat ze het daar over het stroom verbruik hadden.
Wel interessant om te zien in de door jou gelinkte artikelen, dat vooral 'Adaptive Boost' het stroomverbruik omhoog jaagd bij intel. Voor een fractie meer prestaties gebruikt het aanzienlijk meer stroom.
Dat is een groot nadeel van die Intels op 14nm, ze kunnen heel hoog klokken, maar het stroomverbruik stijgt exponentieel. Wat ook niet help is dat veel mobo fabrikanten de voltages aan de hoge kant hebben ingesteld om er zeker van te zijn dat ook met een matig CPU exemplaar nog de hoge boost klok gehaald kan worden. Zelf heb ik momenteel een voorkeur voor AMD, maar dat betekend niet dat met de huidige prijzen en beschikbaarheid Intel een slechte keus is, je moet alleen de K-CPU's wel een beetje tweaken. Het voltage kan vaak wel met 0.10 tot 0.15 V lager ingesteld worden wat al flink in verbruik en temperatuur scheelt en je kunt een hele hoge boost vermijden door in het BIOS de klok te vast te zetten (het is immers een K-CPU).
Damn en ben net meer dan 100 euro pm teruggeschroefd en game niet dagelijks dus zal wel meevallen voor mij
Had eerst de i7 4770k van ergens in 2014, nu pas geupgrade naar i9 10850k en de andere pc mag naar familie
Sneller dan de 5800X? Alleen in multithread lukt dat af en toe (lang niet altijd). Terwijl de 5800X met de 10850K in single-core en gaming de vloer aanveegt en ook nog eens slechts krapjes meer dan de helft verbruikt. Dat soort verschillen zijn makkelijk genoeg om de meerprijs van een paar tientjes van de 5800X te rechtvaardigen. 10th en 11th Core zijn eigenlijk alleen aantrekkelijk als je al op Socket 1200 zit en een beetje een upgrade nodig hebt. Veel ruimte naar boven is er immers niet op dat platform. Wie nog geen platform heeft, laat staan al op AM4 zit, heeft in nagenoeg alle opzichten meer aan de Ryzen 5000 serie. Van betere presetaties, bij lager verbruik tot ruimer upgradepad en meer PCIe lanes.
Wat betreft upgrade naar een 10th gen van een veel lagere generatie daar ben ik mee eens. Ik ben zelf van een 7600k enkele maanden geleden overgegaan naar een 10850k.
Dit is een immense upgrade, dat begrijp je wel.
Maar wat betreft de benchmarks tussen een 5800x en de 10850k daar ga ik niet mee akkoord0
Ik heb vele benchmarks gezien, en de 5800x is echt niet veel sneller,en wordt zelfs in verrschillende games verslagen door de 10850k die beter geoptimaliseerd, (gebinned) is dan de 10900k, allhoewel het om de zelfde chip gaat.
De betere bin is toch echt de 10900K, dus dat doet mij een beetje twijfelen over je bronnen.
En ja, de 5800X wint niet elke game benchmark, maar het gros is wel degelijk in het voordeel van de AMD en in de handvol uitzonderingen gaat het niet echt om noemenswaardige verschillen. En ja, de 5800X is niet altijd veel sneller dan de 10850K, maar dat zei ik ook nooit. Dat neemt niet weg, dat ie voor verreweg de meeste games EN multithreaded productiviteitstaken gewoon sneller is dan de 10900K (soms toch echt wel met een aardige marge), laat staan de 10850K met zijn nog iets lagere kloks en dat terwijl ie minder stroom slurpt.
Waarom heeft intel meer dan 2 maanden na de uitgave van de 10900k de 10850k uitgebracht denk je?
Niet zomaar hoor.
De 10850K is gewoon beter, en alle fouten die met de 10900k werden gemaakt zijn met deze rechtgezet.
En... lagere kloks?! Door 100mhz?!! Op dat vlak heeft de 10900K nog geen 1% snelheid winst tegenover de 10850K die "nogmaals" gewoon beter is, ondanks dat het om dezelfde chip gaat. Eigenlijk zou ik moeten zeggen dat de 10900K eigenlijk de 10850K had moeten zijn ;-)
+ de 10850K is ook nog stuk goedkoper en beter verkrijgbaar, ik zou eigenlijk jammeren moest ik in het bezit zijn geweest van een 10900K..nadat de feiten boven water zijn gehaald..
Groeten
[Reactie gewijzigd door Heav_y_Fun op 22 juli 2024 20:42]
De yield was te slecht om genoeg 10900K's te maken dus hebben ze een submodel gecreëerd (de 10850K) met lagere clocks zodat ze de slechtere chips daarin kunnen stoppen. Weet niet wie je verteld heeft dat de 10850K beter is maar dat is dus gelogen.
Thus entered the Core i9-10850K. A slightly less aggressive product, offered at a cheaper price, and because of the less aggressive bin, available in sufficient quantities to keep system builders and end-users happy if the 10900K was not in stock locally.
Letterlijk uit het artikel dat jij aanhaalt. De 10900K moet aan strengere eisen voldoen. Dat konden niet genoeg chips, dus toen hebben ze de eisen versoepelt en er een 10850K van gemaakt, die inderdaad in de praktijk niet meetbaar onderdoet voor de 10900K als je tenminste niet gaat overklokken, maar wel degelijk het mindere silicon bevat.
Wel een beetje een getuingenis van de kwaliteit van het publiek hier inmiddels dat jij met je alternatieve feiten over de 10850K een +2 krijgt. WTF mensen.
[Reactie gewijzigd door Darkstriker op 22 juli 2024 20:42]
ik heb vorig jaar een nieuw systeem gekocht een 9 serie i5 9600k en ik ben er tot nu toe tevreden mee.
Software matig doe ik niet meer zoveel met de computer het is meer internetten en af en toe een spelletje spelen.ik ben er volledig van bewust dat amd de laatste tijd heel erg goed bezig is zich ook en op alle fronten high mid en low range een serie processor laten zien die de moeite waard zijn om te kopen.
ik heb nu 8 gb geheugen maar daar gaat verandering in komen ,ik denk dat ik 2 reepjes van 16 gig erin zet zodat ik weer future proof ben.Aan bijde fronten is amd beter geworden ze hebben idd de prestatie troon te pakken met die threadripper menig i9 processor van intel kan daar niet tegen op.
Bovendien zijn ze aan de haal gegaan met de nieuwe videokaart lijn en ook daar zijn ze bijna meester in geworden.Mijn moederbord kan crossfire aan .
Plus had ik ergens gelezen dat nvidia stopt met sli videokaarten.En amd gaat er gewoon mee door.
Daarom zijn ze bij intel nu aan het innoveren voor niet achter op te geraken met de techniek.
En geloof me het was al jaren andersom dat intel het voortou had, ik hoop dat amd dit vol houdt
En door gaan met innoveren en door gaan met steeds verbeterde kleinere wordende processor.
ik hoop dat ze nooit meer achter de feiten gaan hollen zoals dat al sinds mensen heugenis al gaande was van amd.
[Reactie gewijzigd door rjmno1 op 22 juli 2024 20:42]
Ook sneller in games. Als is het voordeel dat de 10900K en 10850K in games t.o.v. de 5800X hebben te verwaarlozen, +1% bij 1080p en even snel bij 2160p op een 3080FE
Platform is inderdaad een ding en zoals ik al eerder melde, zelf gaat mijn voorkeur naar AMD uit (en het liefst de 5900X zodra deze voor een redelijke prijs leverbaar is), maar als iemand toch een Intel wil dan is de 10850K een betere koop dan de 11700K.
Ach ja, gelukkig dalen de prijzen inmiddels wel en als de crisis over is ook weer redelijk terug naar nomaal gaat. Heb toch eerder dat het geld van de cpu eerder naar de fabrikant dan naar andere partijen.
Heeft het met de crisis te maken tho? Toevallig gisteren de Ryzen 5000 review nog eens gelezen en daarin staat;
Niet langer budgetkoningen
Wat tot minder enthousiasme zal leiden, zijn de prijsverhogingen die AMD voor deze generatie heeft doorgevoerd. AMD is zich ervan bewust de leidende partij te zijn en dat zie je terug in de prijsstelling. Gevoelsmatig zijn de verhogingen nog wat groter. Dat heeft twee oorzaken; de Ryzen 3000-serie is sinds zijn release stevig in prijs gedaald en de Ryzen 5 3600 heeft (nog) geen opvolger gekregen, terwijl dat prijstechnisch veruit het interessantste model was.
Ik heb liever dat er 50 euro op komt in plaats van 500 zoals bij Intel gebeurde. Ik heb geen idee over de kosten van AMD trouwens. De concurrentie in de paar Fabs die dit kunnen maken is ook enorm toegenomen, dus ik weet niet of daadwerkelijk de winst toegenomen is per processor...
Vervelender is dat er tekorten zijn: als Intel en AMD enorme voorraden zouden hebben dan daalt de prijs vanzelf. Nu zitten we ook nog eens met een overspannen markt voor GPU's en voor een deel CPU's.
De Ryzen 5 en 7 5000 cpu's kun je momenteel gewoon aan msrp kopen. Ja ze kosten 40-50 euro meer dan de vorige generatie, maar ze zijn deze keer ook beter dan de concurrentie. AMD is geen liefdadigheid, bij top prestaties hoort een prijs.
Hangt natuurlijk een beetje af van welk gokproduct je aan het minen bent, ik kan ze zo bij naam niet noemen maar er zijn een aantal die proberen het zo te maken dat GPUs niet effectief zijn om te minen.
Dan heb je nog nooit van Monero gehoord. Monero word over het algemeen gemined op een CPU en niet op een GPU. Dat komt omdat RandomXmonero (het algoritme van Monero) beter werkt op CPU's dan op GPU's.
Hoewel Monero geen Etherium is, is 1 monero al ongeveer $250 waard, en ook die coin stijgt, dus interessant voor de gokkers die denken dat Monero ook veel waard word.
Op zich niet echt kleinerend denk ik. Er zijn duizenden verschillende crypto currencies, er zullen niet duizenden overblijven uiteindelijk die men echt gebruikt. Denk ik. Ook dat is een gok.
De 5900X is nog steeds niet fatsoenlijk leverbaar, want tja, dat is de enige CPU waar je enigzins efficent op kan minen.
Zucht
Ik hoop toch dat dit niet de reden is, ik wacht ondertussen alweer maanden op deze processor. Plaats 30 op de Megekko wachtlijst Die CPU komt ook bijna nooit binnen, laatst een drop gehad van ongeveer 100 maar dat was ook de eerste sinds een goeie maand of twee.
Begin dit jaar een videokaart gehaald...simpele rx 580....kostte toen 225 euro.
Keek ik afgelopen weekend in de pricewatch....tegen de 600 euro. Ben dus echt blij dat ik hem toen heb aangeschaft.
Nou dat is niet jammer. Als beter product krijgt mag er ook meer voor gevraagd worden is teveel da ga stap lager. Dat AMD nu ietje meer vraagt , en geen extreem edition prijzen zoals iNtel. heeft de consument ook AMD in mindere tijden ook keihard laten vallen en dat laten vallen start in de retail markt.
AMD moet gewoon gezonde ASP vragen want dat is er ook ruimte om te innoveren voor genoeg reserves voor R&D.
De consument heeft AMD niet keihard laten vallen, de gemiddelde pc koper gaat naar een Media Markt of een Coolblue en koopt een kant en klaar systeem. Daar had je jaren lang de keuze iNtel, Intel, inTel, inteL of intEl processor doordat Intel zo vriendelijk was de PC bouwers de keuze te geven: of je gebruikt onze processoren en niks anders, of je staat achteraan in de rij. Dus een HP, Compaq, DELL, Lenovo, noem maar op, alles was Intel en nagenoeg niks anders. Slechts een enkele PC bouwer waagde zich aan AMD, maar had je als niet tweaker keuze tot een jaar of wat geleden ? Amper want Intel had de markt nagenoeg volledig in zijn greep door wurgcontracten. Heeft de consument dus AMD laten vallen ? Nee, Intel heeft AMD dermate in de hoek gedrukt indertijd door diverse contract constructies met PC bouwers dat AMD er gewoonweg niet tussen kon komen.
Grootste nadeel voor AMD is nog steeds dat iedere consument die eigenlijk amper wat van een computer weet zich nog steeds herinnert oh Intel was altijd het advies... en dat zal AMD nog wel een lange tijd dwars blijven zitten. Intel kent iedere boeren lul, als ik over AMD begin staan velen nog steeds met de oren te klapperen alsof ik Chinees spreek.
[Reactie gewijzigd door lameeuw op 22 juli 2024 20:42]
AMD heeft een groot deel van hun bestaan op prijs moeten concurreren met Intel omdat Intel de prestatiekroon stevig in handen had, daarbij speelde zeker voor het Zen-tijdperk dat AMD hoge schulden had en de Bulldozer CPU geen serieuze concurrentie was voor Intel. Het zag er toen alles behalve florissant uit. Nu ze de kroon van Intel hebben overgenomen en niet verplicht langer op prijs moeten concurreren met Intel is het logisch dat ze iets meer marge pakken. Enerzijds om hun financiële positie / reserves te verbeteren, maar belangrijker ook te kunnen blijven investeren in ontwikkeling van nieuwe producten.
Vooral ook om de kas te spekken voor het moment dat Intel wel zijn productie op orde krijgt. Dan zal het waarschijnlijk weer net zoals in de athlon tijd gaan prijzen gaan omlaag en de marges zullen dalen. Want laten we niet vergeten dat waarschijnlijk de enige reden is dat Intel nog geen prijzen oorlog begonnen is omdat zij ook hun totale productie al 4 jaar achter elkaar uitverkopen.
En in tegenstelling tot 15 jaar geleden heeft AMD nauwelijks nog tafel zilver over om te gelde te maken in een tijd van liquiditeits problemen. Dus nu moeten ze het zelf doen zonder harde assets te gelde gemaakt kunnen worden zoals fabs, niet gebruikt ip. Alles wat te verkopen was is namelijk al verkocht om zen te kunnen ontwikkelen wat gelukkig voor ons een succes is geworden.
Ook voor de consument is het niet al te slecht dat Intel momenteel matig presteert en AMD de prijzen verhoogt, op de korte termijn is dit inderdaad kut voor de consument maar op de lange termijn is het goed voor de consument. AMD heeft jaren aan de afgrond gestaan en nu een beetje buffer opbouwen voor wanneer (niet of) Intel terugkomt is zeker niet slecht. Je moet wel gezonde partijen hebben als je concurrentie wilt en AMD was niet al te gezond voor een lange tijd, zou mij niks hebben verbaasd dat als Ryzen een flop was ze zichzelf in de uitverkoop hadden gezet of delen hadden moeten afstoten.
Een paar jaar matige concurrentie om AMDs zakken te vullen en het marktaandeel goed te krijgen lijkt mij voor de consument het beste uitpakken over de lange termijn.
Het is en blijft bijzonder jammer dat AMD vlotjes 50 euro extra rekent voor hun nieuwste CPU's.
En toch is dat, zelfs voor minst gunstig geprijsde CPU van de serie, de 6 core, nog steeds ruim onder wat intel vroeg per core tot begin 2019.
De 8700k had een MSRP van 360 dollar, de 5600x is nu 300.
in dat perspectief gezet is de premium die AMD nu vraagt voor de in nagenoeg alle gevalle snellere, en zuinigere, CPU nog heel bescheiden in vergelijking met de concurrent 2 jaar terug.
[Reactie gewijzigd door Countess op 22 juli 2024 20:42]
Het is nu aan Intel om weerwerk te bieden om zo de prijs naar omlaag te halen, want volkomen concurrentie is nog steeds dé beste uitkomst voor de consument.
Wat je ziet is simpelweg het gevolg van marktwerking.
Snap wat je bedoelt met de AMD 5000 serie prijsverhoging. Ben ook teleurgesteld en de CPU upgrade uitgesteld.
Voor de grap heb ik zojuist PC build test gedaan met een 11600K en een 5600X systeem. Verrassend was de 5600X systeem €10 goedkoper! Bij AMD 5600X zit namelijk al een koeler inbegrepen en bij beide platformen heb ik de 2e goedkoopste moederbord geselecteerd om outliners te voorkomen. Als ik de 3e of 4e etc. goedkoopste moederbord selecteer wordt het voordeel 5600X systeem alleen maar groter door de enorme assortiment. Tja, als ik de dagprijzen zo bekijk dan moeten we eigenlijk niet de vinger naar AMD wijzen maar naar Intel. Al heeft Intel al zijn prijzen verlaagt maar blijkbaar nog niet laag genoeg ten opzichte van de technisch en veel zuiniger AMD's 5000 serie.
Het antwoord gaat nog geruime tijd nee zijn. Ik ben er van overtuigd dat Intel uiteindelijk weer goed gaat komen, maar ze lopen nu toch echt een jaar of 2 achter...dus voorlopig...
Alder Lake wordt hopelijk het keerpunt voor Intel. Reuze benieuwd naar de big.LITTLE concept op x86 x64 platform. Niet lang daarna worden we getrakteerd op AMD's ZEN 4. Man, the CPU "dark ages" zijn gelukkig voorbij.
Nou ik zie het zo. AMD global foundry liep regelmatig achter of gelijk met intel .
AMD met TSMC loopt nu gelijk of voor tov iNtel.
Ik denk dat Foundry's grote invloed hebben op wie voor of achter loopt en in wat voor mate.
En bij AMD is dat extreem mis gegaan.
Nou, we weten alvast welke CPU er in de 'disappointment build' 2021 van GamersNexus komt te staan...
Man, je verzint het niet - 300W voor een 8 Core processor
GamersNexus test op een andere manier en zet in de bios van de moederborden de door Intel opgegeven specificaties aan. Bij hun is het stroomgebruik volgens mij ook wat minder; laat niet weg dat ik denk dat ze deze CPU daar inderdaad voor gebruiken .
GamersNexus test op deze manier, maar als de helft van de moederbord fabrikanten die specificaties van Intel aan hun laars lappen dan is het dus per gebruiker anders wat het resultaat is. Wat in mijn inziens niet positief is.
Het lijkt wel alsof ze de FX9590 proberen in te halen qua power consumption.
Ja ongelooflijk, systeemverbruik met Cinebench 20 uit de stopcontact, 208w voor de AMD Ryzen 9 5950X, en 355w voor de Intel Core i9-11900K, waneer die maar 8 cores heeft, en de AMD Ryzen 9 5950X heeft 16 cores, 2x zo veel, en hoe kan het dat de AMD Ryzen 9 5900X meer stroom verbruikt dan de AMD Ryzen 9 5950X??
En als je meer dan genoeg heb aan een 6 core CPU, is de Intel Core i5-11600K best een leuke keuze, de AMD Ryzen 5 5600X is wel wat sneller, maar kost ook €86 meer dan de Intel Core i5-11600K.
Het zal van individuele CPU tot CPU afhangen, niet elke 5900X en 5950X boost hetzelfde. Ze hebben wel hetzelfde TDP (105W) en het verschil in deze test is 11W. De 5950X is waarschijnlijk ook een beter gebinde chip dan de 5900X.
Laten we wel zijn, Tweakers laat alle bios settings van de mobo fabrikanten gewoon aan staan. Multicore enhancement etc. Ze worden buiten Intel zijn "spec" getest. En dan zit er ook nog verschil tussen de merken, want er zijn gevallen bekend dat een Gigabyte bord er 50watt meer uit trekt dan een Asus.
De Intel Core i9 11900K is de eerste processor die zelfs met de ventilators op volle draaisnelheid niet voldoende gekoeld wordt om throttling te voorkomen. Al na enkele seconden begint de processor te throttlen, maar het duurt anderhalve minuut voordat de temperatuur en kloksnelheid helemaal gestabiliseerd zijn. We noteren een maximumtemperatuur van 94 graden en een gemiddelde kloksnelheid van 4,95GHz; de officiële allcoreturbo is 5,1GHz. Je kunt gerust stellen dat deze processor zonder waterkoeling eigenlijk niet afdoende te koelen valt;
Hier moest ik serieus om lachen. Echt, dat ze zo'n product durven uit te brengen...
Ik neem aan dat de enige reden voor deze CPU is om nog ergens een intel-CPU hoog in de benchmark-grafieken te krijgen. Er is geen engineer die als advies geeft om dit ding gewoon een turbo naar 300W te geven.
Fun fact: Intel heeft dit ding een TDP gegeven van 125W.
[Reactie gewijzigd door bwerg op 22 juli 2024 20:42]
Ja het is wel bizar.
Je zou er nog wat aan kunnen hebben met bepaalde emulators.
Zodra n frame getekend is, begint ie standaard meteen met rekenen voor t volgende frame.
Maar n snelle CPU is daar snel klaar mee, daarna zit ie alleen maar te wachten tot t daarop volgende frame berekend moet worden.
Dan kan je die reken fase ook naar later verschuiven, hoe sneller je CPU hoe later. Waardoor je input latency omlaag gaat (input wordt dichter bij het volgende frame uitgelezen).
In dat geval doet je CPU dus snel afwisselend piekvermogen en idle, dus gemiddeld n stuk minder.
Maar goed, dat is wel een heel specifieke use case.
Bij huis/tuin/keuken gebruik zal t ook vast wel sneller zijn, maar daar heb je dan weer geen 11900K voor nodig.
Volgens mij komt dit door het moederbord wat zich niet aan de specificaties houdt.
Als ik het goed heb zijn er ook moederborden die de 11900K gewoon op 125W houden, met uiteraard nog iets mindere prestaties.
Onderaan een vergelijking tussen producten in de Pricewatch zie je sinds enige tijd alle benchmarks. Zo kun je zelf eenvoudig elke vergelijking maken die je wil. Bijvoorbeeld in dit geval: vergelijking tussen Core i7 11700K en Ryzen 5 5600X
@Tomas Hochstenbach ik denk dat er een foutje in de data verwerking zit van de 11900k vs 5900X..
bij Total War 1920x1080 medium 99p, staat een voordeel voor de 11900k van 100% omdat de 5900X volgens dat statestiekje op 3225 ms uitkomt, maar dit is eigenlijk 3,225ms (komma ontbreekt dus). vond het een groot verschil en even bekeken op de product pagina van de 5900X zelf :-).
Maar dan nog ben je min of meer gedwongen om een koeling te kiezen die de max load aan kan. Dat je tijdens het gamen niet een paar cent meer per uur kwijt bent lijkt me niet veel gamers te interesseren. Dat je niet met lucht kan koelen maar waterkoeling moet gebruiken lijkt me voor veel mensen echt een veel groter probleem.
Een 11700K zou je wel met lucht kunnen koelen, de CPU schakelt dan wel terug als de temperatuur te hoog wordt. De prestaties gaan wat minder zijn in benchmarks, maar je ziet dat deze CPU's met waterkoeling ook al throttlen. De prestaties van een Ryzen processor zijn ook temperatuur gebonden, met een betere koeler haal je daar ook meer uit de CPU, dus zowel bij Intel als bij AMD moet je investeren in goede koeling als je het onderste uit de kan wilt van de CPU, omdat dit gewoon factory overclocked CPU's zijn. Vroeger had je nog een allcore marge van meer dan 1GHz met luchtkoeling, terwijl je nu met een manuele overclock die CPU's eigenlijk langzamer maakt.
Heel het punt van de vorige poster was net dat in games het stroomverbruik niet zo hoog is als in een synthetische test. Praktisch al het stroomverbruik van een CPU moet ook weg als hitte, minder stroomverbruik betekent dus minder hitte, betekent dus dat een minder goede koeler volstaat voor die workload.
hierse, kom je nog wat ruime informatie delen over de waarheden en ervaring?
Zullen we de threads er even bijnemen waar je hoog bij laag aangeeft dat de 5800x een koeling probleem heeft? kijk misschien even in de benchmarks van deze site en de resultaten met de dark pro koeler?
Dat kan per game nogal verschillen. Een meer CPU bound game waar je gaat voor 1080p voor die hoge FPS dan kan je mogelijk toch dichter in de buurt van cinebench komen.
Tja je wilt niet dat je met je online party op zonnige dag 35 graden je systeem crash in potje waar je hele goede momenten had.
Qua prestaties... de 11700K doet het best aardig in productivity, dus zolang je niet gaat gamen is het een optie. Maar dan kom je bij het stroomverbruik en de temperaturen en dan zie je dat je de hele Rocket Lake (alweer) kan overslaan.
Er lijkt me geen reden om de 5600x niet te nemen dan indien dat de keuze is.
De underdog steunen is het meestal long term al waard gewoon uit principe, wanneer die underdog dan nog gewoon even goed of beter is wordt het wel heel simpel.
Zouden jullie in jullie reviews voortaan ook het stroomverbruik in games kunnen meenemen? Zeker met een architectuur die in de marketing vooral op gamers wordt gericht is het frapant dat jullie alleen het stroomverbruik in professionele applicaties laten zien.
De marketing van een fabrikant lijkt me de verkeerde reden om een testmethode aan te passen. Maar buiten dat: stroomverbruik in games is wel interessant, maar vanwege de matige consistentie lastig te meten. Ik zet 'm op de ideeënlijst, misschien kunnen we er wat op vinden, bv. een extra lange test om het gebrek aan consistentie te compenseren.
Top, je zou ook een gemiddelde kunnen nemen van het stroomverbruik in jullie verschillende gamingbenchmarks bij elkaar om een wat consistenter beeld te krijgen.
Ik denk dat er toch best een hoop mensen zijn die deze cpu's puur voor gaming kopen, zeker de 6 core modellen. Dan is het wel interessant om te zien of daar grote verschillen zitten in stroomverbruik.
Hardware Unboxed neemt het sinds kort ook mee in hun reviews.
Zelf ben ik dan ook erg benieuwd naar een 11400f. De 10400f was heel goed in spellen, beter dan verwacht en een geduchte concurrent van de Ryzen 3600. Naast dat ie best wel een klap goedkoper was. Als het alleen om spellen ging was dat een heel interessante CPU. Maar door de beperkte geheugenondersteuning (max 2666) was de ervaring soms minder. Nu kon je ook alleen geheugen overclocken met een duur moederbord met Z serie chipset.
De 11400f doet DDR4 3200 als standaard dus heeft die beperking niet meer. Maar wel de lage prijs. Maar je kunt nu ook op de H570 en B560 je geheugen overclocken.
Mocht de 11400f nu rond de 150 euro zitten, net als z'n voorganger dan is het ineens een bijzonder interessante CPU voor je game pc. Zeker omdat AMD er niet echt een antwoord op heeft in die lage prijsklasse. Zo is intel ineens de budgetkoning.
Het gaat in deze review ook alleen over de 125w tdp varianten. Ik ben benieuwd hoe de 65w tdp varianten het er vanaf brengen. Stuk interessanter voor ITX builds.
[Reactie gewijzigd door fapkonijntje op 22 juli 2024 20:42]
Is het verbruik CPU puur gemeten of indirect dus systeem verbruik.
Verklaring zou mobo kunnen zijn.
Zo niet.
Andere verklaring is dat de chiplets de midrange en lowbudged de mindere chiplets zijn. En hoe volledig kwa Vdd-Vss cores disabled zijn in de chiplet.
iNtel Die zijn monolitische chips . Dat zijn vaak de betere chips uit de wafer.
Het is zeker de moeite waard om mee te nemen omdat het stroomverbruik in games een heel ander beeld geeft dan het stroomverbruik in applicaties met AVX:
Dat hoge energie gebruik is de schuld van de moederbord fabrikanten, niet Intel.
De boostclocks e.d. worden constant aangehouden ipv. op timers zoals Intel aanraad.
Ook worden cores constant op hun max multiplier gehouden ipv. dat ze per 2 iets lager geclocked worden.
Tweakers test dit mijn inziens verkeerd. Eigenlijk zouden al dit soort mobo "optimaties" uitgezet moeten worden.
Dat wil niet zeggen dat ik dit geen matige cpu's vind.
[Reactie gewijzigd door Xfade op 22 juli 2024 20:42]
Zo zet Intel de CPU`s niet in de markt, dus hoe Gamersnexus test is het juiste.
Wat Intel wel moet doen is moederbord fabrikanten verplichten om instellingen zoals MCE standaard uit te laten zodat de CPU gewoon de Intel specificaties aanhoud.
Volgens mij ben je beter af als je géén fanboi bent, en je afweging voor aanschaf maakt puur op basis van product naar product. Anders zouden zelfs merken als Corsair (de RM serie is goed qua voedingen, CX serie... not-so-much...) kansloos zijn...
Als je nu beslist een CPU te kopen, tsja, dan zou het meestal (!) wel AMD zijn, maar als het aankomt op low-power office machines; tsja... AMD is momenteel niet zo sterk in het beschikbaar hebben van betaalbare IGP-SKU's... hoewel dat natuurlijk het gebied is waar ARM ook stevig bezig is.
Een fabrikant is inherent geen fan van jou, en je zult dus case-by-case je keuze moeten maken. Ik heb momenteel een threadripper 3960x-gebaseerde machine (best wel wat € naar Lisa en haar companen), maar pre-Zen, bulldozer era... tsja... Patrick en z'n collega's hebben me toen een investering zien doen in X99 (en Z97 onder m'n TV). De rollen zijn nu omgekeerd, in een ideale wereld zal je dus inderdaad een AMD CPU in veel gevallen gebruiken. Als je het kan kopen en de scalpers niet bezig zijn.
Alle kans dat dit later omgekeerd is, immers, Intel heeft alle bestuurslagen net omgedraaid, en ook ARM blijft aan de weg timmeren. In de praktijk maakt het me niet uit wat er in m'n PC zit, ik ben geen fanboi van iets behalve goed werk kunnen doen. Ik denk dat we juist blij moeten zijn dat er zó veel gebeurd momenteel in CPU land. Het is zó lang zó saai geweest toen AMD niet echt sterk bezig was (en ARM nog niet buiten telefoons wou komen en een mega hoge IPC-gap moest inhalen). Het is juist een geweldig leuke tijd om PC's te bouwen. Er is keuze!
(in een ideale wereld waar we daadwerkelijk dingen kunnen kopen)
Het hangt dus van je use case af. Wil je per se AVX512 gebruiken of bijvoorbeeld voornamelijk operaties doen op integers/decimals/floats, zit je nog bij Intel. In alle andere gevallen zal AMD de betere koop zijn.
Alleen wat is dan het kader voor "dat soort workloads". In het geval van machine/deep learning snap ik het.
Echter zijn GPU's niet zo nauwkeurig met getallen, dus dat limiteert het al.
Corsair heeft wel fijne garantie. Na 4,5 jaar een nieuwe PSU gekregen vanwege 5 jaar garantie. Dat was een CX versie. Hij rebootte onder zware belasting.
Als je nu beslist een CPU te kopen, tsja, dan zou het meestal (!) wel AMD zijn,
Is dat zo? Met de huidige prijzen is de 10 serie erg interessant. De 10600K is onder de 210 euro gezakt, de 10400 zit rond de 155 euro. Streamen kun je in beide gevallen met de IGP. De moederbord prijzen zijn ondertussen een stuk schappelijker geworden. Een degelijk full ATX Z490 bordje heb je voor minder dan 145 euro. Ondertussen zijn Z590 m-atx bordjes onder de 140 gezakt. Tevens is B560 een optie, vanaf 85 euro, omdat memory OC nu op de lager geplaatste borden is toegestaan.
Wil je de beste gaming cpu dan kom je bij de 5600X uit. Maar voor wie net wat minder wenst te besteden is Intel momenteel erg aantrekkelijk. Dat is an sich wel grappig want vroeger vervulde juist AMD die rol.
[Reactie gewijzigd door sdk1985 op 22 juli 2024 20:42]
Intel is verdient momenteel nog geld genoeg om te investeren in R&D. Toen ze in het verleden qua prestaties even ingehaald werden door AMD hebben ze ook vele jaren gehad dat ze vastzaten met een inefficiente architectuur, om vervolgens iedereen te verrassen met de core duo reeks
Als consument ben je het meeste gebaat bij een sterke concurrent voor AMD.
Op de lange termijn zijn we er juist bij gebaat als de (ex?) OEM monopoly-misbruiker intel nog een paar jaar flink loopt aan te modderen.
Dat stelt AMD in de gelegenheid om richting de 50/50% marktaandeel kan klimmen, en dat zal hopelijk de enorme berg geld waar intel op ligt te slapen enorm doen krimpen, voor ze hem weer gaan gebruiken om AMD buiten de markt te houden zoals ze deden in de tijd van de Athlon en athlon64.
(en ja daar zijn ze voor veroordeeld (in de EU, Japan en Zuid Korea), maar dat vechten ze nog steeds aan dus ze vinden blijkbaar dat ze toen niks fouts hebben gedaan, en hebben dus nog niks geleerd)
Alleen dan hebben we een goede kans op echte concurrentie op de langere termijn.
Gebeurt dat niet, dan zijn we zo weer terug bij af en krijgen we weer 10 jaar aan stagnatie
[Reactie gewijzigd door Countess op 22 juli 2024 20:42]
Gebeurt dat niet, dan zijn we zo weer terug bij af en krijgen we weer 10 jaar aan stagnatie
Je ziet hier een causale relatie (oorzaak gevolg) die er niet is. Tussen mei en augustus wordt er meer ijs verkocht en tegelijkertijd zijn er helaas ook meer drenkelingen. Dan kun je beweren dat meer ijs zorgt voor meer drenkelingen, maar dat slaat natuurlijk nergens op.
AMD was na OEM gate geen zielig en kansloze kuikentje. Sterker nog AMD heeft 5.4 miljard op tafel gelegd om Ati (van Radeon videokaarten) over te nemen. Hiervan was 4.2 miljard cash en slechts 1.2 miljard in aandelen. Die 5 miljard was vijf (!) keer hun jaarlijkse R&D budget. Dit bedrag is zo hoog dat je nooit kunt beweren dat de problemen die AMD heeft gekend een gevolg zijn OEM gate. In plaats van Ati over te nemen had AMD dit geld ook kunnen investeren in R&D, bijvoorbeeld in hun foundries (kijk eens wat een geld TSMC nu verdiend).
Er is iets anders gebeurd en dat is een combinatie van twee factoren. De eerste is dat de overname van Ati voor AMD slecht uitgepakte. Er bleek veel te veel betaald te zijn en 2 miljard werd vrijwel direct afgeschreven. Daarna bleek dat onder leiding van AMD de GPU tak eigenlijk geen winst te maken. Tot slot van ramp bleek de consument de APU's niet te waarderen. De APU's hadden weliswaar een sterk grafisch deel maar hun cpu deel was wat trager. Hierdoor daalde de gemiddelde verkoopprijs per cpu (ASP). In plaats van waarde toe te voegen door APU's te verkopen bleek de dure apu strategie juist de prijzen en marges te verlagen. Toen dit duidelijk werd, 2 jaar na de dure overname, is AMD het R&D budget systematisch gaan verlagen. Tussen 2008 en 2016 structureel verlaagd van 1.8 miljard in 2008 tot 0.9 miljard in 2016. Dit is dus niet een direct gevolg van OEM-gate, maar van de APU strategie.
Het tweede probleem is dat AMD het geloof in de toekomst van de (high end) pc markt verloor. De pc markt was jaren aan het krimpen en er zou geen toekomst meer in zitten. Gaming zou allemaal richting consoles opschuiven. Dat is de primaire reden dat AMD niet meer in HPC actief werd, AMD maakte een draai richting semi-custom. Dat was een keuze van AMD zelf.
Ondertussen zijn we heel wat jaartjes verder. Onder leiding van Raja Koduri heeft AMD een draai gemaakt. Ze zijn gaan inzetten op VR gaming en dus high performance computing. Zo kwam AMD niet alleen met Polaris maar ook met Zen. Tevens is de APU strategie grotendeels overboord gegooid. Sterker nog er zit niet eens een klein IGPtje in het gros van de Ryzen line-up. Het is AMD zelf die de eigen problemen heeft opgelost. Primair door nieuw personeel in dienst te nemen die overduidelijk betere beslissingen nemen dan het vorige management. Waaronder de keuze om simpelweg de prijzen te verhogen bij succes.
[Reactie gewijzigd door sdk1985 op 22 juli 2024 20:42]
je onderschat zwaar de duur, en ernst van 'OEM gate' (zelfs de term 'OEM gate' maakt het veel kleiner als dat het echt was. het was niet 1 incident maar een structurele stragetie van intel die ze jaren lang hebben toegepast, en ik verwacht eigenlijk nogsteeds toepassen in subtielere vorm) .
Je doet net alsof er na OEM gate helemaal geen gevolgen meer zijn geweest voor AMD.
Intel's monopoly misbruik was al aan de gang in de jaren 90, en is de primaire reden dat AMD voor de athlon en athlon64 maar 1 fab te beschikking had omdat intel's ijzen greep op de OEM markt investeerder in AMD heeft weggejaagd terwijl AMD op zoek was naar kapitaal om de productie capaciteit uit te breiden.
En juist dat slechts 1 fab hebben maakte het voor AMD moeilijk om dat OEM monopoly te doorbreken. en het hebben van slecht 1 fabs was een enorme rem op AMD's groei tijdens het athlon64 en Opteron tijdperk, wat weer een enorme dopper was op hun winstgevendheid. En op dat moment van success hebben ze de gok moeten nemen om zelf een 2de fab te financieren, maar die was uiteindelijk pas te laat operational om te er met de athlon64 nog van te profiteren. En toen die klaar was moest gelijk de eerste fab verbouwd worden van 200mm naar 300mm.
Als AMD wel die 2de fab veel eerder gefinancierd had gekregen, en daarmee 2 fabs operationeel had kunnen hebben rond de launch van de athlo64 was de fout van het te veel betalen voor AIT nooit zo'n probleem geweest, was er meer R&D geweest voor de CPU en nieuwe nodes, en was de APU daarmee gelijk een stuk competitiever geweest.
Ja AMD heeft ook fouten gemaakt, maar hoe ernstige de gevolgen van die fouten zijn komt toch elke keer weer terug op intel's monopoly misbruik en de schade het het AMD daarmee, jaren lang, heeft gedaan.
Tussen 2008 en 2016 structureel verlaagd van 1.8 miljard in 2008 tot 0.9 miljard in 2016.
Dat ze in die period hun fabs hebben verkocht en dus geen R&D uitgaven meer hoeft te doen aan steeds duurder wordende nodes laat hier vast per ongeluk buiten beschouwing.
Het punt is dat AMD ná de periode die in de rechtzaak wordt aangehaald die 5.4 miljard kon uitgeven. Natuurlijk kun je argumenteren dat AMD zonder OEM gate veel groter was geweest. Wellicht is dat ook een valide argument. Wie weet had AMD dan 8 miljard cash gehad. Alleen het is niet de oorzaak van de stagnatie. Dat stagnatie volgt uit de investeringen (Ati), de APU strategie, het systematisch korten op R&D en de beslissing om pc dood te verklaren.
Ik geloof ook niet, jij volgens mij ook niet, dat het recente succes van AMD volgt uit ander gedrag van Intel. Het is de nieuwe aanpak die AMD succes brengt; meer R&D, geen APU focus, duurdere producten, hogere marges, geen prijsvechter meer willen zijn, jaarlijkse refreshes, enz. Lisa Sue had die 5.4 miljard ongetwijfeld zinniger besteed. Vermoedelijk hadden we dan nu een nog succesvoller AMD en een los Ati Radeon bedrijf met een omzet van pak hem beet 5 miljard (ging meestal gelijk op met Nvidia).
Dat ze in die period hun fabs hebben verkocht en dus geen R&D uitgaven meer hoeft te doen aan steeds duurder wordende nodes laat hier vast per ongeluk buiten beschouwing.
Nee joh, AMD heeft het GlobalFoundries verhaal in 2010 afgerond. In 2012 hebben ze hun laatste 14% in GlobalFoundries afgestoten. Die daling van het R&D budget heeft jaren lang doorgezet kon na het afstoten van de fabs niks te maken met het verkopen van de fabs.
Hier zie je ook meteen wat een verschil die 4 miljard cash had kunnen maken. Voor slechts 1.7 miljard had AMD in die jaren gewoon het niveau van 2011 vast kunnen houden.
[Reactie gewijzigd door sdk1985 op 22 juli 2024 20:42]
Intel heeft deze generatie gewoon volledig de plank misgeslagen, en daar lijkt men eigenlijk bij Intel niet echt mee te zitten. Ze hebben het vizier gericht op 2023 en hun 7nm processoren. De vraag is dan alleen wel hoe de consument hier mee om gaat, want 2 a 3 jaar gewoon niet met de concurrent mee gaan kan moordend zijn. AMD is namelijk ook heel lang gewoon echt stukken minder geweest als Intel.
Ik zie en lees uberhaupt het sentiment dat Intel generatie 11 gewoon had moeten overslaan, en de review van Tweakers bevestigd dat. Als je als bedrijf ieder jaar iets wil lanceren, maar je hebt een jaar gewoon niks; lanceer dan ook niks.
7nm in 2023?? Ik mag voor Intel toch hopen van niet, voor zover ik weet komt AMD met haar 5nm CPUs aan het einde van dit jaar. Als Intel dan twee jaar later pas met 7nm komt aanzetten halen ze dat nooit meer in.
Niet echt, als jij met een budget werkt is intel nog steeds master, een i5-10600kf kost maar 189,- en is hooguit een paar fps langzamer na een oc dan een 5600x met de allerdikste videokaart, voor het gros van de mensen zal het een verwaarloosbaar verschil zijn want niet iedereen heeft een 3080/90, dus heb je voor het geld van een amd cpu een intel cpu + mb, dit bespaart je extra geld wat je weer in een ander onderdeel kan stoppen.
Mee eens!
Daarom blijf ik wel even met mijn 10850k en zelfs Alder Lake overslaan. Met 10c/20t zit je wel nog vele jaren zoet, tenzij u geld wilt verspillen
OEMs eisen elk jaar een nieuw product. Dit moet ruim voor de zomer leverbaar zijn zodat er tijdens het back to school seizoen verkocht kan worden. Intel kon dus niet anders dan nu de 11 serie vernieuwen.
Daarnaast is backporting nu standaard een uitvalsweg voor élke nieuwe architectuur. Wellicht wilde ze alvast wat ervaring op doen .
[Reactie gewijzigd door sdk1985 op 22 juli 2024 20:42]
Intel komt toch dit jaar nog (als alles goed gaat) met 10nm (+- TSMC 7nm) desktop processors, dus er zijn wel degelijk pogingen om een inhaalslag te maken. Ja AMD komt dit jaar ook nog met 5nm processors (+- Intel 7nm), als alles goed gaat, en loopt dan toch weer uit.
Het is natuurlijk koffiedik kijken wie er wel of niet die doelstelling gaat halen. Ze hebben allebei wel nieuwigheden (DDR5, nieuw platform) die tot uitstel kunnen leiden en het ook niet zo interessant maken om er naar te upgraden. Meestal is een nieuwe generatie RAM geheugen initieel duurder, trager en minder beschikbaar dan de vorige, het is altijd even wachten op de hoger geklokte varianten en brede beschikbaarheid.
Zoals anderen aanhaalden, is het gewoon zo dat OEMs elk jaar "iets" nieuws verwachten om nieuwe systemen rond te bouwen. Maar in de backport van Sunny Cove naar Cypress Cove zit wel veel werk en R&D, daar moet ik Intel wel krediet voor geven. En iets uitbrengen is wel degelijk beter dan niets, dat is net wat AMD verkeerd heeft gedaan in de jaren voor Zen 1. Rocket Lake is nu geen Zen 3 killer, maar plak er de juiste prijs op (lees goedkoper dan 5800X) en het is wel concurrentieel.
Het is natuurlijk makkelijk om Intel hier te bashen en uit te lachen over de slechte prestaties en de regressies die er zelfs vaak zijn.
Maar het is van groot belang om te onthouden dat we concurrentie op deze markt willen, en niet een situatie waarin AMD de nieuwe Intel wordt.
Ik hoop daarom dat Intel flink kan inhalen met de volgende generatie, en AMD weer flink laat schrikken. Laat ze maar lekker vechten voor onze eurodollars - daar plukken wij consumenten te vruchten van.
Maar het is van groot belang om te onthouden dat we concurrentie op deze markt willen, en niet een situatie waarin AMD de nieuwe Intel wordt.
Zo’n vaart zal het niet lopen. Toen Intel de overhand na en AMD wegdrukte, was Intel al vele malen groter dan AMD, dat is nog steeds zo. Zoals je zelf ook aangeeft hoop ik ook dat Intel kan terugslaan. Goed voor de prijzen en goed voor de innovatie.
Er is toch concurrentie ja iNtel heeft problemen maar niet van die orde dat ze low ASP moeten verkopen. Er is TDP handicap. AMD verkoopt hun top AM4 CPU iig niet als iNtel Extreem edition voor 1500 euro. AMD 10 en 12 core mogen best wel meer kosten dan 8core snelste van iNtel.
Dat is concurrentie . Ten 1ste door de hevige concurrentie strijd bied door AMD meer value per aantal cores. En iNtel kan er met de 11th gen niet in mee. ivm TDP.
AMD mag underdog zijn maar is zeker geen B merk product . Kwa kwaliteit heeft intel genoeg incidenten. Je krijgt nu meer CPU voor pegels en dat is aanzienlijk. Veel cores XE van 1500 tot wat vroeger alleen xeons boden zijn nu stuk betaalbaar geworden.
Waar prijs bump van 50 euro gewoon verbleken.
Dus subtiel meer prijs voor refresh met betere performance. Zorgt ook voor genoeg cash reserves R&D.
Tijdens het lezen van de review was ik zo'n 3 minuten enthousiast voor de i5 11600k... tot dat ik het energie verbruik zag.
Voorlopig blijf ik tevreden met mijn 8600k. Sowieso wordt het pas zinvol te upgraden als de chip crisis is opgelost.
Tijdens het lezen van de review was ik zo'n 3 minuten enthousiast voor de i5 11600k... tot dat ik het energie verbruik zag.
Voorlopig blijf ik tevreden met mijn 8600k. Sowieso wordt het pas zinvol te upgraden als de chip crisis is opgelost.
Ik ben vooral verbaas over het verschil tussen de 5600X en 5800X in verbruik. Qua prestaties ontlopen ze elkaar niet heel veel, maar qua opgenomen vermogen ligt de 5800X gelijk met de 5950X. Is de 5600X dan bizar zuinig, of de 5800X bizar onzuinig?
Zo te zien voor Singleplayer 4K Ultra en zelfs 1440p kan ik nog wel ff voorruit met mijn 7700K en RTX3080.. ik speel toch geen competitieve multiplayer, zie niet veel voordeel in een nieuwe CPU.

:fill(white):strip_exif()/i/2004237278.jpeg?f=thumblarge)
:fill(white):strip_exif()/i/2004237246.jpeg?f=thumblarge)
:strip_exif()/i/2006074966.webp?f=thumblarge)
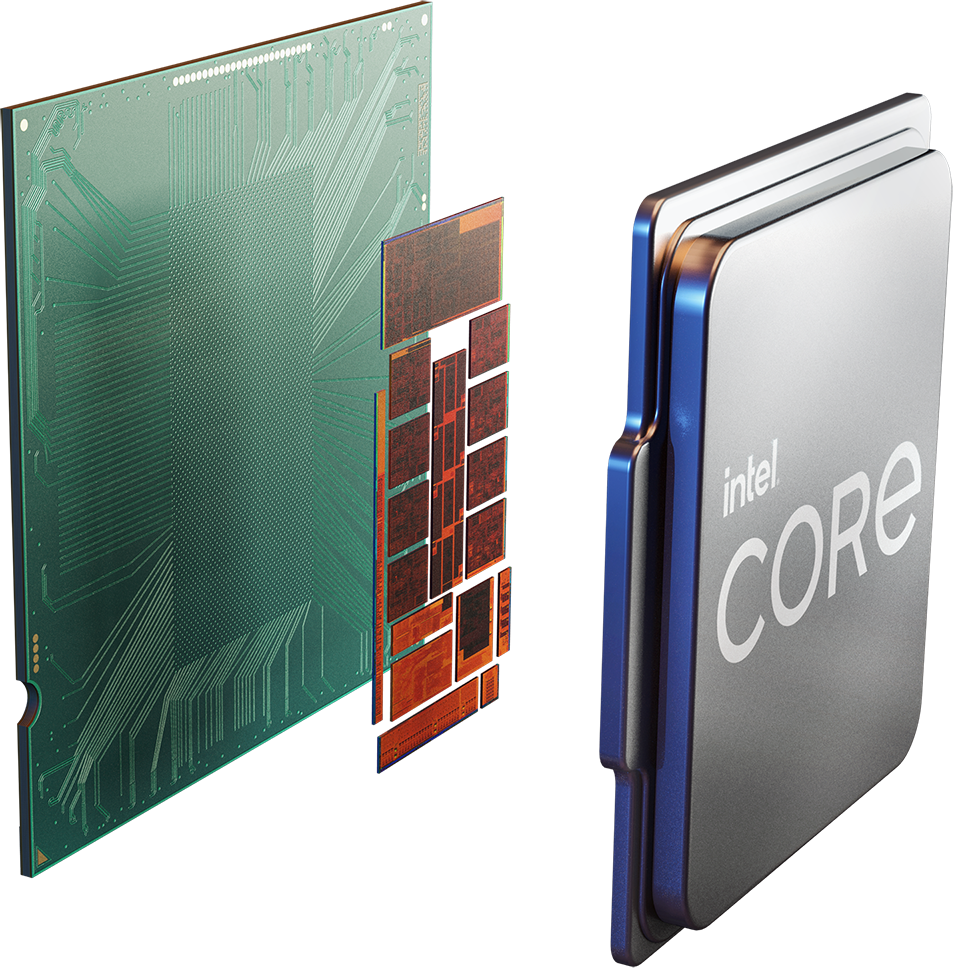
/i/2004260532.png?f=imagegallery)
/i/2004260546.png?f=imagegallery)
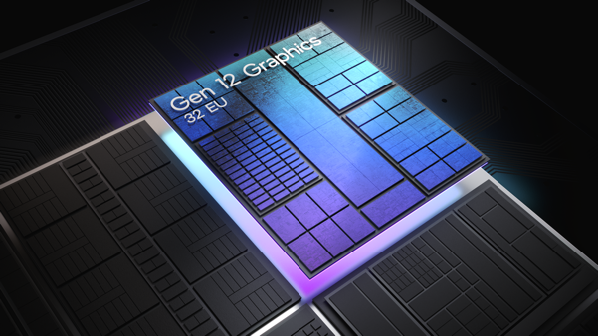
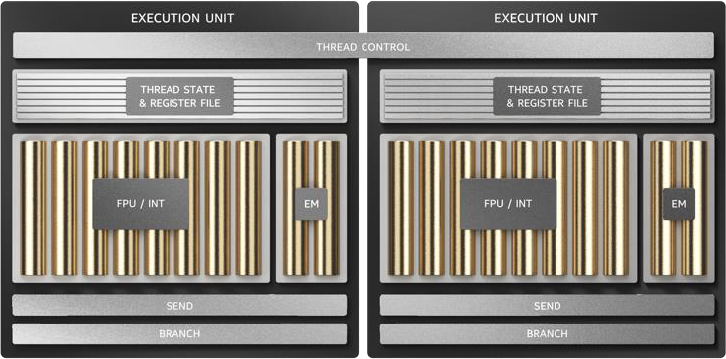

:strip_exif()/i/2003978910.jpeg?f=imagegallery)
:strip_exif()/i/2003978908.jpeg?f=imagegallery)
/i/2003971560.png?f=imagegallery)
:strip_exif()/i/2006074966.webp?f=thumb)
:fill(white):strip_exif()/i/2004237246.jpeg?f=thumb)
:fill(white):strip_exif()/i/2004237278.jpeg?f=thumb)
:strip_exif()/i/2006074966.webp?f=thumbmedium)
:fill(white):strip_exif()/i/2004237278.jpeg?f=thumbmedium)
:strip_icc():strip_exif()/i/2004582430.jpeg?f=fpa_thumb)
/i/2004545386.png?f=fpa_thumb)
/i/2004294210.png?f=fpa_thumb)
:strip_icc():strip_exif()/i/2004279522.jpeg?f=fpa_thumb)
:fill(white):strip_exif()/i/2004237246.jpeg?f=thumbmedium)
:strip_icc():strip_exif()/i/2004240782.jpeg?f=fpa_thumb)
:strip_icc():strip_exif()/i/2003978744.jpeg?f=fpa_thumb)
/i/2004611214.png?f=fpa)
:strip_exif()/i/2003847926.jpeg?f=fpa)
:strip_icc():strip_exif()/u/56926/MGA_new.jpg?f=community)
:strip_exif()/u/4143/crop673c629560e43_cropped.gif?f=community)
:strip_icc():strip_exif()/u/184388/crop603011eec3eb5_cropped.jpg?f=community)
:strip_icc():strip_exif()/u/436083/crop57ffdfe53151a_cropped.jpeg?f=community)
:strip_icc():strip_exif()/u/890277/crop625f50598d2f4_cropped.jpg?f=community)
/u/183354/day.png?f=community)
:strip_icc():strip_exif()/u/777781/crop5bd71656d105b.jpeg?f=community)
:strip_icc():strip_exif()/u/423227/crop6272ea0207346_cropped.jpg?f=community)
:strip_icc():strip_exif()/u/1453702/crop5f5fce4e09040_cropped.jpeg?f=community)
/u/152928/crop5f2a6769d94ac.png?f=community)
:strip_icc():strip_exif()/u/481280/Foto%2520van%2520mij%25204.jpg?f=community)
:strip_icc():strip_exif()/u/235429/crop5ec389b86a87b_cropped.jpeg?f=community)
:strip_icc():strip_exif()/u/1344096/crop5e51bd482905f_cropped.jpeg?f=community)
:strip_exif()/u/1054665/crop5be31086906cf_cropped.gif?f=community)
:strip_icc():strip_exif()/u/81611/headcrop.jpg?f=community)
/u/42690/crop69fd07463237b_cropped.png?f=community)
:strip_icc():strip_exif()/u/6764/cergorach.jpg?f=community)
:strip_icc():strip_exif()/u/22588/472892.jpg?f=community)
:strip_icc():strip_exif()/u/83337/countess6-nice.jpg?f=community)
:strip_icc():strip_exif()/u/80624/crop56269c878c330.jpeg?f=community)
:strip_icc():strip_exif()/u/456604/crop5f9da8323848e_cropped.jpeg?f=community)
:strip_icc():strip_exif()/u/18149/catfish60.jpg?f=community)
:strip_exif()/u/211274/bestabstractwallpapers5.gif?f=community)
:strip_icc():strip_exif()/u/116283/crop5814e3224425d_cropped.jpeg?f=community)
:strip_icc():strip_exif()/u/33497/crop5e7214432b417_cropped.jpeg?f=community)
/u/472627/crop5c83fe498b36e_cropped.png?f=community)
:strip_icc():strip_exif()/u/73625/Tetris_failure_ava_forum.jpg?f=community)
/u/286895/icon1.png?f=community)
/u/407459/tw.PNG?f=community)
/u/2110/Batman-The-Dark-Knight-Theme.png?f=community)
:strip_icc():strip_exif()/u/287731/crop6270fa65746ea_cropped.jpg?f=community)
/u/381607/have%2520a%2520nice%2520day%2520-%2520small.png?f=community)
/u/375226/crop62effc38c6e6e.png?f=community)
:strip_exif()/u/296989/webicon.gif?f=community)
/u/175440/crop5b5f0d899a5e8_cropped.png?f=community)
/u/208684/crop5d9c7a25578e1.png?f=community)
:strip_icc():strip_exif()/u/225731/crop5ed89a79424f7_cropped.jpeg?f=community)
/u/221550/crop5fe07fea87d40_cropped.png?f=community)
:strip_icc():strip_exif()/u/1131627/crop611cd2f3232f4_cropped.jpg?f=community)
:strip_icc():strip_exif()/u/57655/SuperTeamLogo.jpg?f=community)
/u/131439/417785s.png?f=community)
/u/331213/crop56ef13408ff38_cropped.png?f=community)
:strip_icc():strip_exif()/u/398657/crop5880bd73194ae_cropped.jpeg?f=community)