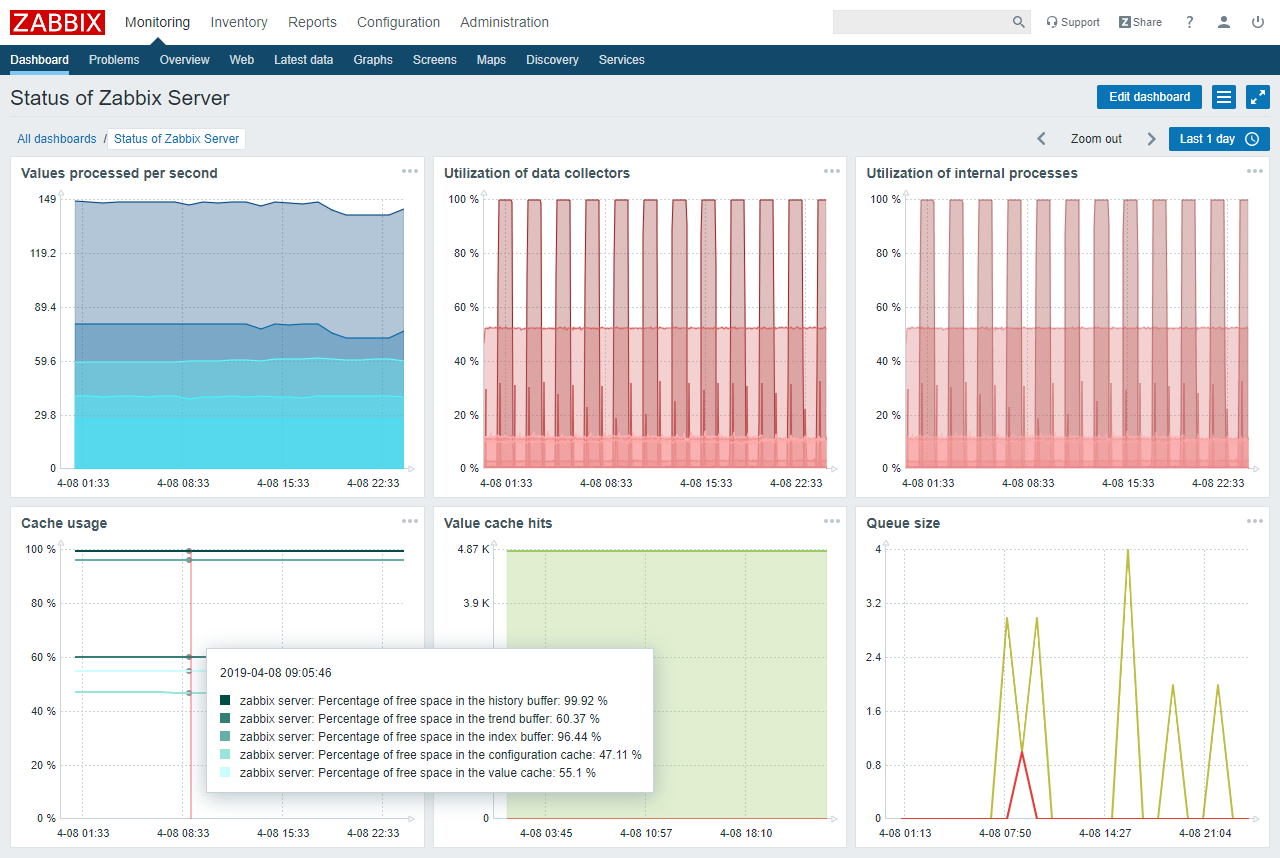
 Versie 7.0 van Zabbix is uitgekomen, een versie met extra lange ondersteuning. Met dit programma kan de status van netwerkservices, servers en andere netwerkapparatuur in de gaten worden gehouden. Hoewel het programma alleen simpele informatie kan weergeven, kan door het installeren van een zogeheten agent op de server ook gedetailleerdere info worden verkregen. Meer informatie over Zabbix kan op deze pagina worden gevonden en hier staan enkele screenshots. Uitgebreide informatie over de veranderingen in deze uitgave staan hier, dit zijn in het kort de belangrijkste:
Synthetic end-user web monitoringMonitor websites and web applications by defining flexible multi-step browser based scenarios
Zabbix proxy high availability and load balancing
- Capture screenshots of the current website state
- Collect and visualize website performance and availability metrics
- Extract and monitor any data from your web application
- Analyze the collected data and receive alerts related to any discovered problems
Scale your Zabbix environment as you go and ensure 100% availability with automatic proxy load balancing and high availability features
Faster and more efficient Zabbix proxies
- Assign hosts to load-balanced proxy groups
- Seamlessly scale your Zabbix environment by deploying additional proxies
- No limitations for number of proxies and proxy groups
Zabbix proxy now supports fully in-memory data storage for the collected metrics
Improved data collection speed and scalability
- Choose from Disk, Memory and Hybrid proxy buffer modes
- Memory mode enables support of edge-computing use cases
- Up to 10-100x better proxy performance, depending on the allocated hardware
- Ideal for embedded hardware
To greatly improve speed and scalability of metric polling, synchronous poller processes have been replaced with asynchronous pollers
Centralized control of data collection timeouts
- Faster metric polling for agent, SNMP and HTTP checks
- Next metric can now be polled before waiting for a response from previously requested metric
- Support of up to 1000 concurrent checks per poller process
Centralized control of data collection timeouts enables better support for metrics and custom checks taking longer data collection time intervals
New ways to visualize your data
- Define individual item-level timeouts
- Override timeouts on a per-proxy level
- Timeouts are now fully configurable in the Zabbix GUI or via Zabbix API
A variety of new dashboard widgets have been introduced enabling more comprehensive overview of your monitored metrics and infrastructure.
Major network discovery speed improvementsParallelization support has been introduced to network discovery, improving the speed of host and service discovery by measures of 10-100x
Dynamic dashboard widget navigation
- Network discovery now supports concurrent checks within a network discovery rule
- Support of concurrency enables major network discovery speed improvement
- Network discovery errors are now displayed in the frontend
A new communication framework has been introduced for dashboard widgets, enabling communication between widgets
Enterprise-grade multi-factor authentication support
- A widget can behave as a data source for other widgets - for example, to display information about a host selected on geographical or network maps
- Information displayed in dashboard widget is dynamically updated based on the data source
- Build a custom interactive Zabbix dashboard for your use case
Out-of-the-box support of multi-factor authentication (MFA) enables enterprise-grade security and more flexibility for configuring user authentication methods
More flexible resource discovery and management
- Time-Based One-Time Password (TOTP) authentication
- Duo Universal Prompt authentication
Low-level discovery has received a variety of improvements, which enable enhanced host configuration and management flexibility when discovering hosts in complex environments, such as VMware or Kubernetes
- Ability to link hosts discovered by LLD to groups created by other LLD rules
- Ability to automatically disable lost resources
- Changed the default LLD rule update interval to 1 hour
Choose the behavior when a discovered resource is marked as lost
New templates and integrationsZabbix 7.0 LTS comes pre-packaged with new templates and webhooks for the most popular vendors and cloud providers:
- Google Cloud Platform
- Microsoft Azure Cost Management
- Microsoft Azure Cosmos DB for MongoDB
- Amazon Elastic Container Service
- AWS ELB Application Load Balancer
- Oracle Cloud Infrastructure
- Microsoft SQL by Zabbix agent 2
- Microsot SQL by ODBC template improvements
- CheckPoint Quantum Security Gateway
- Nextcloud
- Fortinet FortiGate
- HPE iLO
- Cisco SD-WAN
- HashiCorp Nomad
- PostgreSQL by ODBC
- OpenStack Nova
- Acronis Cyber Protect Cloud
- YugabyteDB
- Event-Driven Ansible Webhook
- Mantis Bug Tracker


:fill(white):strip_exif()/i/2007605540.jpeg?f=thumbmedium)