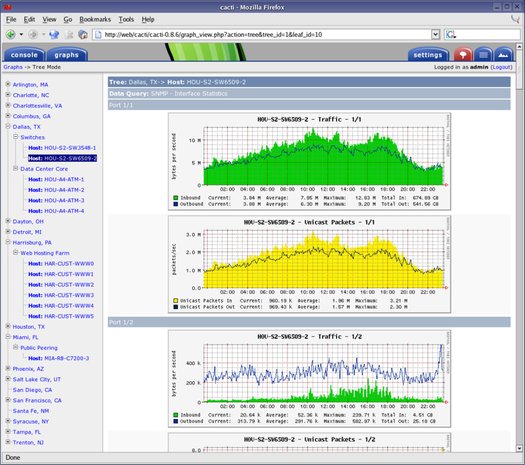
Cacti is volledige frontend voor RRDTool, een applicatie waarmee je op gezette tijden informatie kan binnenhalen van je netwerk en aangesloten apparatuur. Cacti kan deze binnen gehaalde informatie overzichtelijk weergeven in verschillende grafieken waardoor je in één oogopslag de prestaties over een bepaalde periode kan zien. Het vereist een omgeving met MySQL, PHP, RRDTool, net-snmp en een webserver met PHP ondersteuning, zoals Apache of IIS. Voor meer informatie verwijzen we jullie door naar deze pagina en verschillende real-life voorbeelden zijn via deze pagina op te zoeken. De ontwikkelaars hebben onlangs versie 0.8.6i op de wereld gezet met de volgende aanpassingen:
Important Bug Fixes:What's New?
- There have been a whole bunch of fixes related to the tree presentation when using the graph export functionality.
- A couple issues related to the default scripts and templates that ship with Cacti have been addressed. This includes the Unix get free disk space script, the WeatherBug script, the load average script, and the default memory usage graph.
- Extend the maximum size of multiple database columns which will enable more graph tree items and longer SNMP OID's.
- Several RRA-related issues have been corrected which are related to graph tree items, the timespan field on the RRA form, and graph exporting.
- RRDtool graph DEF's are now generated for items other than AREA, STACK, LINE1, LINE2, and LINE3 such as COMMENT and GPRINT. This allows you to reference data on the legend that is not being graphed.
Upgrade Notes:
- Column sorting has been implemented throughout the console which can be used by clicking on a column header to toggle sorting between ascending and descending order.
- Graph exporting is now able to assume a user in Cacti which can be used to restrict which graphs are exported based on that user's graph permissions.
- The functionality of the poller cache, SNMP cache, and Cacti log file viewers have been improved significantly by adding pagination and filtering support.
- A user log viewer has been added which displays all successful and failed login attempts and allows the results to be filtered and purged from the database.
A few minor database tweaks have been made in this version, detailed below.
[break]
- The ID column in the graph tree items table has been extended to support up to 16,777,216 items.
- The length of several columns have been extended to allow for SNMP OID's greater than 255 characters in length.
- A PID column has been added to the poller time table which can be used for statistical reporting and debugging.
- The default "Get SNMP Data" and "Get SNMP Data (Indexed)" data input methods have been extended to allow a custom SNMP port to be specified.


/i/1233959057.png?f=thumbmedium)