Introduction
 When we managed to get our hands on a server with two Intel Xeon 'Woodcrest' processors for the first time, we were very impressed with its performance. Not only did this lead to an extensive review, but it was also the main reason to select these chips for the configuration of Apollo 5, the database server of our forum Gathering of Tweakers (GoT). This machine is now operational, but naturally it was subjected to severe testing before entering the server room in Amsterdam. In this review, we give the results of our benchmarks.
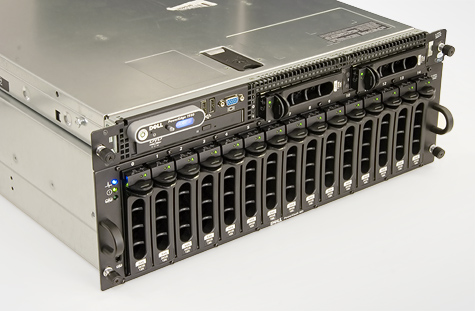
Apollo 5 is a Dell PowerEdge 1950, somewhat different from the Fujitsu-Siemens RX300 S3 which we examined earlier. The two brands differ in terms of design and price as well as in the possibilities for upgrading, management and service. Since both machines use the same chipset, there is no reason to assume that the brand will play a significant role in this specific test. For other types of workload this might be different, especially when more I/O is involved, but we shall nevertheless assume that it is negligible. Of course, there are other differences between the two servers to be examined, or we would not have very much to do in this review. We selected a more expensive version of the processor, more and faster memory and additionally, we installed another storage controller. A run-down of the differences:
| | RX300 S3 | Apollo 5 |
|---|
| Processors | Xeon 5150 (2.66GHz, 65W) | Xeon 5160 (3.0GHz, 80W) |
| Memory capacity | 8GB (8x1GB) | 16GB (8x2GB) |
| Memory speed | 533MHz (17.1GB/s) / CL4 (7.5ns) | 667MHz (21.3GB/s) / CL5 (7.5ns) |
| Storage controller | Areca ARC-1120 (128MB) | Dell PERC 5/E (256MB) |
On the basis of this table, no-one should be surprised that the new Apollo is even quicker than the system we examined earlier, so as far as speed is concerned this article will not contain any surprises. What we can do, however, is use the results obtained with Apollo 5 to draw more conclusions concerning the scalability of the Xeon as well as the effect of the latest Linux kernel, version 2.6.18. Additionally, we have examined the effect of hardware based prefetchers on the basis of AMD's Xeon benchmarks.
It is important to realize that our benchmark method is largely independent from I/O and amount of memory. As long as there is at least (a little more than) 4GB of memory plugged into the server, the hard disks are barely used. In the original article, the RX300 was tested with 6x 1GB and 2x 512MB (a total of 7GB), but this time we simply had 1x 8GB at our disposal. Testing things again was necessary anyway because of the new kernel version, but in fact the difference between 7GB, 8GB and 16GB is not noticeable in this benchmark (this is not exactly true for the production environment of our forum  ).
).

Linux-kernel 2.6.15 vs. 2.6.18
When we compared the results of the Dell PE 1950 in PostgreSQL 8.2-dev with the benchmarks from the previous review, we were initially pleasantly surprised with the difference. However, we soon became suspicious, because in theory it was virtually impossible for our new Dell machine to perform so much better than the Fujitsu which we tested before. We quickly formulated the hypothesis that the new version of the Linux kernel might play a role in the performance increase. Driver problems had forced us to run kernel 2.6.18 on the PowerEdge while the earlier tests had been done with version 2.6.15. To test the hypothesis, the RX300 was also upgraded to the new version, which turned to have a significant influence on the performance indeed. The development version of PostgreSQL 8.2 turned out to facilitate a performance increase of a good 19% with a load of 25 or more simultaneous users.

The picture for MySQL is completely different: with a single core switched on, fair gains can be recorded, but as soon as multiple threads must be handled, the gains turn into losses. Since it wasn't an option to test the Dell server running the old kernel, we decided to re-test the Fujitsu machine with the new kernel. This means that the remaining results in this article have all been obtained with version 2.6.18.


| Difference due to kernel version | MySQL 4.1.20 | MySQL 5.0.20a | PostgreSQL 8.2-dev |
|---|
| 1x single-core | +6,2%  | +2,9%  | +20,2%  |
| 2x single-core | -2,7%  | -4,4%  | +20,2%  |
| 1x dual-core | -1,9%  | -5,8%  | +18,7%  |
| 2x dualcore | -1,6%  | -5,7%  | +16,0%  |
| Average | 0% | -3,3%  | +18,8%  |
Influence of prefetchers
Woodcrest 2.66GHz vs. 3.0GHz
Comparison of scaling behaviour
When we look at the scaling behaviour of the two servers, we see limitations crop up in certain places: the step from one to two processors is less smooth for each of the three databases than what we witnessed before. Even though the results are impressive in an absolute sense, we see, for instance, that adding a second Woodcrest in MySQL 5.0.20a – costing a good 851 dollars – only yields a 6% performance increase. Although it is not the case that this version scales well on other platforms, we do experience this as a disappointment.
The unsatisfactory scaling behaviour of the faster chip cannot simply be attributed to a lack of bandwidth: clock speed – and hence the theoretical computational power of the processor – has increased by 12.5%, while the memory supply an extra band width of 25% in theory. On paper, this means that an extra ten percent more bytes should be available at each tick of the clock for the processors in the Dell PowerEdge than for the Fujitsu RX300's CPU's. Latency, however, has increased: one system has 533MHz of CL4 memory, while the other runs on 667MHz CL5. It is no coincidence that this can be re-valued at 7.5ns in both cases. Since the processor measures time in clock ticks, the same latency gets comparatively longer as the frequency increases. A 2.66GHz chip will see 20 ticks go by in these 7.5ns, while a 3.0Ghz version ticks 22.5 times – a 12.5% increase.
An additional factor that can contribute to poor scaling behaviour is a heavier loading of the buses. In theory, the double 1333MHz FSB has the same band width as the four memory channels, but leaves no headroom for internal communication between the processors. Doing more work increases the need to communicate, leaving less room for reading and writing data. Of course, the latency story is also applicable to the communication between the processors. A final factor that may contribute to the situation is that the minimal amount of I/O actions increases by having faster throughput.
 |
 | Woodcrest 2.66GHz / 533MHz FBD |  |
 |
 | Performance scaling |  |
 |
 | MySQL 4.1.20 | 1x single -> 1x dual |      34% 34% |  |
 |
 | MySQL 4.1.20 | 1x dual -> 2x dual |      17% 17% |  |
 |
 | MySQL 4.1.20 | 1x single -> 2x dual |      56% 56% |  |
 |
 | MySQL 5.0.20a | 1x single -> 1x dual |      22% 22% |  |
 |
 | MySQL 5.0.20a | 1x dual -> 2x dual |      14% 14% |  |
 |
 | MySQL 5.0.20a | 1x single -> 2x dual |      40% 40% |  |
 |
 | PostgreSQL 8.2-dev | 1x single -> 1x dual |      76% 76% |  |
 |
 | PostgreSQL 8.2-dev | 1x dual -> 2x dual |      84% 84% |  |
 |
 | PostgreSQL 8.2-dev | 1x single -> 2x dual |    224% 224% |  |
 |
 |
 | Woodcrest 3.0GHz / 667MHz FBD |  |
 |
 | Performance scaling |  |
 |
 | MySQL 4.1.20 | 1x single -> 1x dual |      34% 34% |  |
 |
 | MySQL 4.1.20 | 1x dual -> 2x dual |      13% 13% |  |
 |
 | MySQL 4.1.20 | 1x single -> 2x dual |      52% 52% |  |
 |
 | MySQL 5.0.20a | 1x single -> 1x dual |      29% 29% |  |
 |
 | MySQL 5.0.20a | 1x dual -> 2x dual |      6% 6% |  |
 |
 | MySQL 5.0.20a | 1x single -> 2x dual |      37% 37% |  |
 |
 | PostgreSQL 8.2-dev | 1x single -> 1x dual |      84% 84% |  |
 |
 | PostgreSQL 8.2-dev | 1x dual -> 2x dual |      77% 77% |  |
 |
 | PostgreSQL 8.2-dev | 1x single -> 2x dual |    226% 226% |  |
 |
Overview
Our second encounter with Intel's Xeon 'Woodcrest' was actually just as good as the first. The somewhat disappointing scaling behaviour is well-compensated by the overall better performance. It is often the case that top-of-the-line models do not offer the best value for money and the Xeon 5160 processors in our Dell PowerEdge 'Apollo 5' are no exception: the 3.0Ghz models are 23% more expensive than the 2.66GHz versions, and on top of that they have a TDP that is 23% higher, but in exchange they offer no more than 10% performance gains. We are lucky enough in not having to save on every Watt or euro, but there are plenty of customers out there who do not have this luxury.
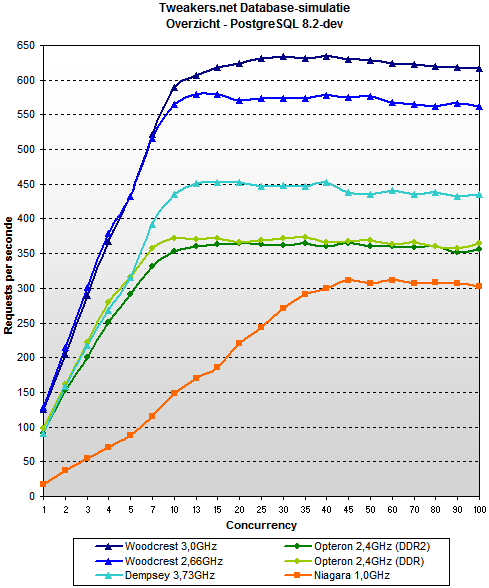
Although benchmarking our Apollo 5 has not revealed anything shocking, we have obtained our sixth data point in our series of server reviews: a handy reference for use in future reviews. So, to conclude this article, let's list all the hardware we've tested so far: Apollo 5 (3.0GHz Woodcrest), Fujitsu-Siemens RX300 (2.66GHz Woodcrest and 3.73GHz Dempsey), Sun Fire X4200 (2.4GHz Opteron Socket 940), Sun Fire T2000 (1.0GHz Niagara) and MSI K9SD Master (2.4GHz Opteron Socket F). More extensive specifications of these machines can be found here.


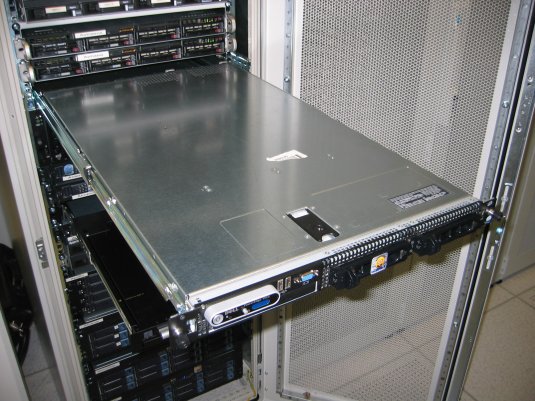
Apollo 5 being rack-mounted, ready to serve 500 tweakers per second
 Earlier articles in this series
 4-9-2006: Intel Xeon 'Woodcrest' 2,66GHz
 30-7-2006: AMD Opteron Socket F
 27-7-2006: Sun UltraSparc T1 vs. AMD Opteron
 19-4-2006: Xeon vs. Opteron, single- en dualcore (in Dutch)
 When we managed to get our hands on a server with two Intel Xeon 'Woodcrest' processors for the first time, we were very impressed with its performance. Not only did this lead to an extensive review, but it was also the main reason to select these chips for the configuration of Apollo 5, the database server of our forum Gathering of Tweakers (GoT). This machine is now operational, but naturally it was subjected to severe testing before entering the server room in Amsterdam. In this review, we give the results of our benchmarks.
![]() ).
).


