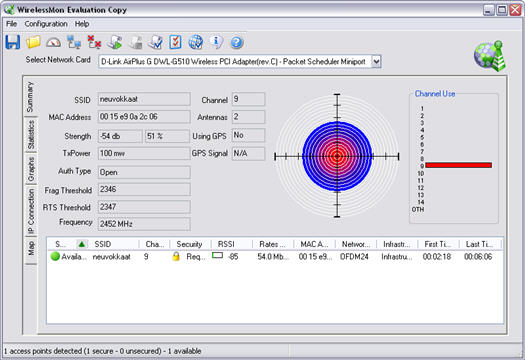
 Passmark heeft een eerste publieke bètarelease naar buiten gebracht van versie 2.0 van WirelessMon. Met dit programma kan de status van de draadloze netwerkkaart en de access points binnen het bereik ervan in de gaten worden gehouden. Zo kan onder andere worden gezien of het netwerk correct is geconfigureerd, kan worden getest of alle componenten naar behoren werken, of de access points beveiligd zijn en wat de doorvoersnelheden van het netwerk zijn. Verder kan het als hulpmiddel dienen bij het lokaliseren van de antenne, in het geval er van directionele antennes gebruik wordt gemaakt, en kan het helpen bij het opsporen van interferentie of andere problemen. Versie 2.0 kent een groot aantal verbeteringen, waaronder ondersteuning voor GPS:
New features in release 2.0:[break]
- GPS support added
- Redesigned user interface, added toolbar and menus, removed the buttons from the bottom of the window.
- Ability to connect to an access point from withing WirelessMon. Right click on an access point in the list on the summray tab and select the "Connect to AP" option from the menu.
- Graphs for "Signal strength (db) vs time" and "Signal strength percentage vs time" and can now be done based on access point rather than just network card.
- WirelessMon window is now resizable.
- Configuration tab has been removed and replaced with a Configuration menu. The new menu is in three sections of general, logging and map options.
- Added "minimise on close" to the general options
- A Map tap has been added, this is for displaying an image and drawing a visual representations of sampled acess point signal strengths. The samples can be taken by either clicking on the image or using GPS coordinates.
- SSID filter list has been added the logging options. If something is entered in this list only SSIDs that match the contents of the list will be logged.
- Added "MapPoint" format options to the access point log and connected node log. This will save these logs in a format ready to import into MapPoint.
- Added a way to customise the colour corresponding to signal strength for the graph on the summary tab and the display of signal strength on the map tab.
 Klik voor een grotere versie.

/i/1216656696.png?f=thumbmedium)